Why the Nifty Is Stuck Below 24,350 — and What Changes on 31 August
Markets · India Equity Briefing · Tuesday, 25 August 2026
Why the Nifty Is Stuck Below 24,350 — and What Changes on 31 August
You opened your app on Monday evening and the screen said almost nothing. The Nifty 50 was down 33 points. The Sensex was down 172. Nothing crashed, nothing ran. And yet the index has spent nearly five weeks refusing to travel more than a few hundred points in either direction, while crude, the rupee and bond yields have all moved a great deal.
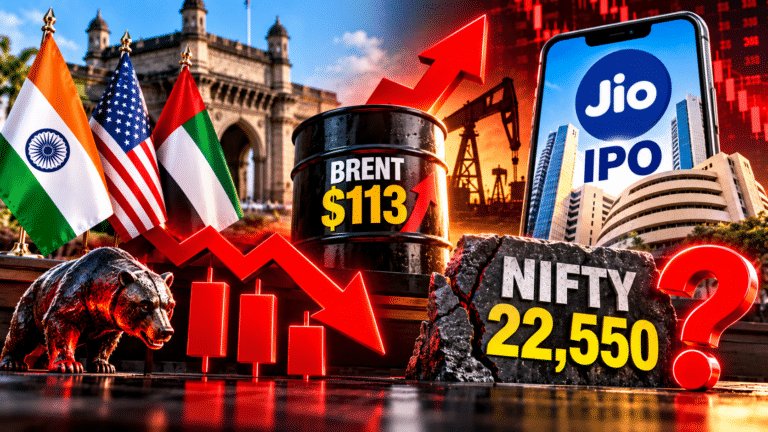
That combination is the story. Today is an NSE monthly derivatives expiry, the United States has moved on fresh Iran sanctions, and in six days the National Statistics Office publishes the first GDP print of FY27. The index is not directionless. It is waiting.
Quick Summary
Indian equities closed lower on Monday, 24 August 2026, with the Sensex at 77,369.11 (down 171.72 points, 0.22 per cent) and the Nifty 50 at 24,219.05 (down 32.95 points, 0.14 per cent), as Iran threatened to disrupt Strait of Hormuz transit ahead of new US sanctions. Nifty Bank ended at 57,525.95, PSU banks fell 0.93 per cent on rising bond yields, and metals rose 1.59 per cent. Macro is the stabiliser: the repo rate is 5.25 per cent, July CPI came in at 4.45 per cent, and FY26 GDP grew 7.7 per cent. The near-term decision level is 24,350.
Indian market overview: where the benchmarks actually stand
Monday snapped a two-session winning run in which the Sensex had added 0.82 per cent and the Nifty 0.72 per cent. The give-back was small but the internals were not flattering: market breadth turned negative, 11 of the 16 major sectoral indices closed in the red, and large caps underperformed the broader market for a second straight session.
The volatility gauge is the number worth pausing on. India VIX at 11.53 is not a panic reading by any measure, yet it rose 2.90 per cent into an expiry week with a live geopolitical event on the calendar. Low absolute volatility with a rising trend is the market’s way of saying it does not expect a shock but is no longer certain enough to sell insurance cheaply.
Beneath the headline indices, dispersion did the work. The Nifty MidCap index rose 0.13 per cent while the Nifty SmallCap fell 0.26 per cent. On the BSE, the 150 MidCap index was effectively flat at minus 0.01 per cent and the 250 SmallCap index slipped 0.17 per cent. Money is not leaving the market. It is rotating inside it, out of rate-sensitive financials and into commodity-linked names.
| Indicator | Level, 24 Aug 2026 | Session change | What it signals |
|---|---|---|---|
| Nifty 50 | 24,219.05 | Down 32.95 pts, 0.14% | Held the 24,200 support on a closing basis |
| BSE Sensex | 77,369.11 | Down 171.72 pts, 0.22% | Underperformed Nifty on financial weightage |
| Nifty Bank | 57,525.95 | Down 0.41% | Bond-yield pressure on lender marks |
| GIFT Nifty | 24,181.50 | Down 0.12% | Flat-to-lower start indicated for Tuesday |
| India VIX | 11.525 | Up 2.90% | Event risk being priced into expiry |
| 10-year G-sec yield | 6.869% | Up from 6.864% | Hawkish read-across hurting PSU bank books |
| Rupee vs dollar | 95.7400 | Firmer from 95.7150 | Stabilising, but far from 2025 levels |
The 2026 round trip: how Dalal Street got to 24,219
Anyone who last checked their portfolio in December is looking at an unfamiliar screen. The Nifty 50 closed calendar 2025 at 26,129.60 and printed a record high of 26,373.20 on 5 January 2026. What followed was a genuine bear phase, not a wobble.
By 2 April the index had touched a 52-week low of 22,182.55, a fall of roughly 15.9 per cent from the January peak. The January-March quarter alone saw the Nifty lose more than 14 per cent. The first half of calendar 2026 ended with the Sensex down about 10 per cent and the Nifty down about 8.5 per cent, only the third time since Covid that the index has closed a first half in the red.
Worked example: what the round trip actually cost
An investor who bought the index at Friday 2 January levels and held through Monday is not down catastrophically. From the 26,129.60 close of 2025 to Monday’s 24,219.05, the price return is a loss of 1,910.55 points, which is 7.31 per cent year to date. Measured from the 26,373.20 record high, the drawdown is 8.17 per cent. Measured from the 22,182.55 April low, the index has recovered 9.18 per cent. Three honest numbers, three different stories, and the one your broker quotes usually depends on what they want to sell you.
The recovery had a clear engine. Domestic institutions kept buying while foreign investors kept leaving. On the NSE cash segment, FIIs have net sold roughly ₹3.40 lakh crore in 2026 to 18 August, while DIIs have net bought roughly ₹5.17 lakh crore over the same stretch. Depository data compiled separately puts calendar-2026 FPI equity outflows at about ₹2.41 lakh crore, already above the ₹1.66 lakh crore recorded across the whole of 2025.
Foreign ownership of Indian equities fell to 14.7 per cent by mid-2026, described in market commentary as a 14-year low. The offset has been retail discipline: monthly systematic investment plan contributions reached a record of roughly ₹32,000 crore. That is the single most important structural fact about this market. The bid of last resort is now a salaried Indian with a standing instruction, not a fund manager in Singapore.
Nifty today, point by point
- Expiry sits on top of an event. Today is the NSE monthly futures and options expiry, coinciding with the fallout from fresh US sanctions on Iran. Rupak De of LKP Securities flagged exactly this overlap, warning traders to expect a volatile Tuesday.
- 24,200 held, but only just. The Nifty slipped below 24,200 intraday on Monday and reclaimed it into the close. The closing recovery matters more than the intraday break, because option positioning is settled on closing levels.
- 24,350 is the level that decides the week. LKP Securities places crucial resistance there, above which a meaningful rally becomes possible. Moneycontrol’s desk view puts immediate resistance at 24,250 on the Nifty and 77,500 on the Sensex.
- Supports are stacked at 24,200 and 24,000. Two supports within one per cent of each other create a shelf. A clean break of 24,000 on volume would be the first genuine technical damage since the June recovery began.
- The daily candle was bearish. A positive open that faded into consistent selling at higher levels produced a bearish daily candle and an intraday reversal formation, which technicians read as continued near-term weakness.
- Breadth disagreed with the headline. On Friday 21 August, 1,859 stocks advanced against 1,602 declines out of 3,586 traded, an advance-decline ratio near 1.16 to 1. By Monday breadth had turned negative even though the index fell only 0.14 per cent.
- Sector rotation is the real signal. Metals up 1.59 per cent against PSU banks down 0.93 per cent in the same session is a commodity-inflation trade, not a growth trade.
- Volatility is cheap but rising. India VIX at 11.53 with a 2.90 per cent daily gain suggests hedging demand is picking up from a low base ahead of expiry.
- The macro calendar outranks the chart. Q1 FY27 GDP lands on 31 August. Positioning ahead of that number will matter more than any level on a screen.
BSE Sensex vs NSE Nifty 50: the August 2026 trend compared
The two benchmarks are telling slightly different stories this month, and the difference is entirely about composition. The Sensex carries a heavier weight of large private financials; the Nifty is broader and picks up more of the metal, energy and IT rotation. On both Friday and Monday, that gap showed up in the numbers.
| Comparison point | BSE Sensex | NSE Nifty 50 | Gap and what it means |
|---|---|---|---|
| Close, 24 Aug 2026 | 77,369.11 | 24,219.05 | Sensex-to-Nifty ratio near 3.19 |
| Session change, 24 Aug | Down 0.22% | Down 0.14% | 8 bps of financial-weight drag |
| Close, 21 Aug 2026 | 77,402.33 | 24,252.00 | Sensex fell 0.17%, Nifty rose 0.08% |
| Week to 21 Aug | About 0.6% lower | About 0.6% lower | Weekly outcome identical |
| Prior two sessions | Up 0.82% | Up 0.72% | Sensex leads on up-days too |
| H1 CY2026 | Down about 10% | Down about 8.5% | 150 bps of underperformance |
| Key technical marker | 10-week EMA at 76,338 | Resistance 24,350 to 24,600 | Both above short EMA, below long ones |
| Immediate resistance | 77,500 | 24,250 then 24,350 | Same wall, two scales |
Choice Broking’s technical view is that the Sensex is consolidating after its correction, closing above its 10-week exponential moving average at 76,338 but still trading below its 20-, 50- and 100-week EMAs. Translated: short-term buyers have returned, medium-term trend followers have not. That is a fair description of the whole market right now.
Key economic drivers: growth, prices, rates and jobs
India’s macro backdrop is doing something unusual. Growth is strong, inflation is rising but contained, policy is on hold, and the labour market is improving. The tension is not domestic. It is imported, and it arrives through a barrel of crude.
GDP: a 7.7 per cent year, then a moderation
MoSPI’s provisional estimates put FY26 real GDP growth at 7.7 per cent, with real GDP reaching ₹323.12 lakh crore and nominal GDP ₹346.36 lakh crore, an 8.9 per cent nominal expansion. The March quarter delivered 7.8 per cent real growth against expectations nearer 7.2 per cent, with nominal Q4 GDP at ₹94.65 lakh crore.
The composition mattered. Trade, hotels, transport and communication grew 12.5 per cent, financial and real estate services 10.4 per cent, construction 8.4 per cent and manufacturing 7.3 per cent, while agriculture managed only 3.6 per cent and mining 5.4 per cent. Services carried the quarter.
The spread between SBI Research at 8 per cent and ICRA at 6.4 to 6.6 per cent is wider than usual, and it exists because June was a strange month. Rainfall ran a 40 per cent deficit, a 12-year high, before July surplus and normal August rains pulled the cumulative shortfall down to about 12 per cent. ICRA’s own Business Activity Monitor registered 12 per cent year-on-year growth in June, a 32-month high, with 13 of 16 constituent indicators accelerating.
CPI inflation: six months up, but the last step was small
MoSPI reported headline CPI at 4.45 per cent for July 2026, released on 12 August, against 4.38 per cent in June and 3.93 per cent in May. The index level is 107.94 on the 2024 base, up 0.88 per cent month-on-month. Inflation bottomed at 3.21 per cent in February and has climbed every month since, though July’s rise was the smallest of the run.
Food is doing the damage. The Consumer Food Price Index rose 5.52 per cent in July, and because food carries close to half the CPI basket weight, rural households felt it harder than urban ones. Analyst-calculated core inflation sat near 3.9 per cent, which is the number the RBI is watching. Energy and food pressure has not spread into the wider price structure.
Repo rate: a fourth consecutive hold, and a deliberate message
At its 62nd meeting, held 3 to 5 August 2026, the Monetary Policy Committee under Governor Sanjay Malhotra voted unanimously to keep the repo rate at 5.25 per cent and retain a neutral stance. The Standing Deposit Facility stays at 5.00 per cent and the Marginal Standing Facility and Bank Rate at 5.50 per cent. It was the fourth straight hold.
Two projection changes carried more information than the rate itself. The RBI raised its FY27 real GDP forecast to 6.7 per cent from 6.6 per cent and cut its FY27 CPI projection to 5.0 per cent from 5.1 per cent, with core inflation projected at 4.3 per cent. Malhotra described the stance as neither dovish nor hawkish. The next MPC meets 5 to 7 October 2026.
Why a hold moved bank stocks anyway
Markets read the August policy as leaning hawkish at the margin, and that reading is now visible in bonds rather than equities. The 10-year benchmark yield edged up to 6.869 per cent on Monday. Rising sovereign yields create mark-to-market losses on the government-securities books that public sector banks carry in size, which is precisely why the Nifty PSU Bank index fell 0.93 per cent while private lenders fell only 0.3 to 0.5 per cent. Bank of Baroda dropped 2.2 per cent, Canara Bank 2 per cent and State Bank of India 0.9 per cent.
Unemployment: the quiet good news
The Periodic Labour Force Survey bulletin for July 2026, the sixteenth in the monthly series and based on responses from 3,71,021 people, put the unemployment rate for those aged 15 and above at 5.1 per cent, down from 5.5 per cent in June and matching a four-month low. A Reuters poll had expected 5.4 per cent.
Rural unemployment fell to 4.5 per cent from 5 per cent, while urban was broadly flat at 6.7 per cent. Labour force participation rose to 55.4 per cent from 54.4 per cent, the worker population ratio to 52.5 per cent from 51.4 per cent, and female participation jumped from 32.7 per cent to 34.4 per cent. MoSPI itself cautions that monthly moves reflect seasonality rather than secular trends, which is a caveat worth keeping.
Latest news highlights and their immediate market impact
- Iran and the Strait of Hormuz. Tehran threatened to seize vessels and alter transit rules ahead of the US sanctions announcement. Immediate impact: Brent held above $90 a barrel after touching near $94 on Friday, up more than 5 per cent for the week, and equity risk appetite thinned through Monday afternoon.
- Bond yields backed up. The 10-year G-sec rose to 6.869 per cent. Immediate impact: PSU banks became the day’s worst sector at minus 0.93 per cent, and the Nifty Bank fell 0.41 per cent while metals rallied.
- Metals caught a commodity bid. The Nifty Metal index rose 1.59 per cent, with Hindalco, JSW Steel and Tata Steel among the Nifty’s best performers. Immediate impact: the metal rally is the single reason the Nifty fell less than the Sensex.
- Gold and silver kept climbing. Comex gold crossed $4,700 and silver traded above $69, while MCX October gold futures rose 0.63 per cent to ₹1,63,459. Immediate impact: a visible haven bid running alongside equities, which is unusual and worth respecting.
- SEBI opened a probe into alleged manipulation during a Sensex expiry. Immediate impact: sentiment risk for expiry-day volumes and a reminder that regulatory scrutiny of derivative settlement is intensifying.
- SEBI impounded ₹3.68 crore of alleged manipulative gains from Copthall Mauritius Investment and Mansi Share and Stock Broking. Immediate impact: limited on index levels, meaningful as an enforcement signal to offshore participants.
- Duty-free raw sugar imports were allowed. Immediate impact: sugar stocks fell sharply on Friday on domestic supply and mill margin concerns, one of the sharpest single-sector moves of the week.
- Defence names sold off. MTAR Technologies, Axiscades Technologies and Hindustan Aeronautics led declines, with the defence index shedding close to 1 per cent. Immediate impact: profit-taking in a sector that outperformed strongly earlier in 2026.
- Proposed US H-1B and OPT fee increases surfaced. Immediate impact: an added cost overhang for IT services, already the weakest sector of the June quarter, on top of the AI-driven pressure on discretionary spending.
- Godrej Industries announced a ₹20,000 crore Haryana investment with 40,000 jobs. Immediate impact: a capex-cycle datapoint that supports the industrial credit story more than any single stock price.
- The primary market stayed hot. Tempsens Instruments was subscribed 158.48 times on day three and Augmont Enterprises 12.42 times on day two, while Skyways Air Services and Symbiotec Pharmalab were still building books on day one. Immediate impact: retail risk appetite is alive in IPOs even as it hesitates in secondary large caps.
Foreign indices that influence Indian markets, and how
India does not trade in isolation, but not every global index matters equally. What follows is the actual overnight and same-session board that Indian desks read before the open, with the transmission channel for each.
| Global marker | Level | Change | Transmission channel into India |
|---|---|---|---|
| Dow Jones | 53,294.39 | Up 0.98% | Sets overnight risk tone for the 9:15 open |
| Nasdaq | 26,192.29 | Up 0.44% | Drives Indian IT sentiment and ADR pricing |
| S&P 500 | 7,693.51 | Up 0.44% | Benchmark for global EM allocation decisions |
| FTSE 100 | 10,832 | Up 0.14% | Commodity and energy read-across |
| DAX | 26,122 | Down 0.05% | Industrial and auto demand proxy |
| CAC 40 | 8,479 | Down 0.06% | Luxury and consumer confidence signal |
| STOXX 50 | 6,546 | Down 0.08% | Pan-European risk appetite gauge |
| Brent crude | Above $90/bbl | Up over 5% on the week | Direct hit to CAD, inflation and margins |
| US 10-year yield | 4.707% | Down 0.65% | Sets the hurdle rate for FPI flows |
| US Dollar Index | 98.89 | Down 0.17% | Weaker dollar supports EM inflows |
Note the contradiction on that board. Wall Street closed higher, the dollar index eased and US yields fell, all of which should have been supportive. Indian equities still fell, because crude and the Hormuz headline overrode everything else. When oil is the binding constraint, global risk-on stops transmitting.
The oil arithmetic that matters most
Analysis circulated during the earlier phase of the West Asia conflict quantified the damage from a sustained three-month supply disruption: a 20 to 30 basis point hit to FY27 GDP growth, a 50 to 75 basis point rise in inflation, a 10 basis point widening of the fiscal deficit and an additional $25 billion on the current account deficit. Emkay warned the Nifty could fall towards 21,000 if crude holds above $100 for three to four months. Brent above $90 is uncomfortable. Brent above $100 changes the entire investment case.
Sector performance India 2026: who is leading and who is lagging
The freshest sector read comes from two consecutive sessions that told the same story from different angles. Metals led both days. Financials, especially public sector banks, lagged both days. IT flipped from laggard to gainer as the rupee stabilised.
| Sector index | 24 Aug move | 21 Aug move | Current earnings driver | What to watch next |
|---|---|---|---|---|
| Nifty Metal | Up 1.59% | Up 0.86% | Firm global commodity prices | Chinese demand and dollar direction |
| Nifty IT | Positive | Down 0.46% | Weakest Q1 FY27 sector on AI-led spending shift | Guidance cuts and proposed US visa fees |
| Nifty Realty | Positive | Up 0.40% | Best-performing index of the June quarter | Rate path from the October MPC |
| Nifty Private Bank | Down 0.3 to 0.5% | Up 0.51% | Industrial credit up 17.5% y-o-y to end-May | Deposit costs and NIM compression |
| Nifty PSU Bank | Down 0.93% | Lagged | Mark-to-market losses on G-sec books | Every basis point on the 10-year yield |
| Nifty FMCG | Mixed | Down 0.74% | Food inflation at 5.52% squeezing volumes | Rural demand after a 12% rain deficit |
| Nifty Auto | Mixed | Down 0.60% | Expected positive Q1 FY27 surprise | Fuel prices and festive bookings |
| Nifty Pharma | Dr Reddy’s a top gainer | Mixed | Defensive bid on rupee weakness | US pricing and regulatory actions |
| Nifty Media | Down 0.58% | Down 0.54% | Weak ad spend cycle | Festive advertising commitments |
| Nifty Cements | Down 0.75% | Mixed | Monsoon-hit despatch volumes | Post-monsoon construction pickup |
| Nifty Defence | Down about 1% | Mixed | Profit-taking after a strong 2026 run | Order inflows and budget allocations |
Two structural points sit underneath that table. First, the banking sector’s fundamentals are stronger than its share prices suggest: RBI data showed bank credit to industry growing 17.5 per cent year-on-year by end-May 2026, a sharp acceleration from 5.3 per cent a year earlier. Second, India Inc delivered 15.6 per cent earnings growth for Nifty 500 companies in FY26, which is the base the market is now being asked to grow from.
Aviation is the standout casualty. ICRA sharply raised its estimate of net losses for Indian airlines to ₹36,000 to 38,000 crore for FY27, citing rupee depreciation and elevated aviation turbine fuel prices. That is the clearest illustration in the market of how an oil shock converts into a P&L hole.
Top gainers and losers: the 24 August movers board
The tables below combine the closing leaders and laggards published by Business Standard and Moneycontrol with the session price snapshot published by HDFC Sky. Where a percentage is not shown, the source confirmed the direction and ranking but did not publish the magnitude.
| # | Gainer | Sector | Move / level | Why it moved |
|---|---|---|---|---|
| 1 | Hindalco | Metals | Up 1.44% at ₹1,048.85 | Aluminium strength, top Nifty gainer |
| 2 | Infosys | IT | Up 1.56% at ₹1,138.50 | Rupee stability and Nasdaq strength |
| 3 | HCL Technologies | IT | Up 1.08% at ₹1,316.60 | Selective buying in large-cap IT |
| 4 | JSW Steel | Metals | Nifty top-five gainer | Firm steel prices, sector at plus 1.59% |
| 5 | Tata Steel | Metals | Up 0.72% at ₹184.31 | Commodity rally read-across |
| 6 | Dr Reddy’s Labs | Pharma | Nifty top-five gainer | Defensive rotation out of financials |
| 7 | HDFC Bank | Private bank | Up 0.70% at ₹732.05 | Held up while PSU peers sold off |
| 8 | Netweb Technologies | Tech hardware | New high, up 40% in a month | Successful qualified institutional placement |
| 9 | Power Grid | Utilities | Led Friday’s advance | Yield-defensive bid in a choppy tape |
| 10 | Kotak Mahindra Bank | Private bank | Led Friday’s advance | Private bank index up 0.51% on 21 Aug |
| # | Loser | Sector | Move / level | Why it moved |
|---|---|---|---|---|
| 1 | BLS International | Services | Down about 13% | Heavy volume, near 52-week low |
| 2 | Bank of Baroda | PSU bank | Down 2.2% | Bond-yield mark-to-market pressure |
| 3 | Canara Bank | PSU bank | Down 2.0% | Same G-sec book problem |
| 4 | SBI Life Insurance | Insurance | Biggest Nifty loser | Rate-sensitive liability book |
| 5 | Bajaj Finance | NBFC | Top-three Nifty loser | Funding-cost sensitivity to yields |
| 6 | Bajaj Finserv | Financials | Top-five Nifty loser | Follows the lending arm |
| 7 | Bharat Electronics | Defence | Down 0.53% at ₹411.80 | Defence index down about 1% |
| 8 | Adani Ports | Infrastructure | Top-five Nifty loser | Hormuz shipping-disruption risk |
| 9 | Cipla | Pharma | Down 1.09% at ₹1,416.60 | Stock-specific, against a firm sector |
| 10 | State Bank of India | PSU bank | Down 0.9% | Index heavyweight dragging Sensex |
Ten stocks on the 2026 radar, and how to value them honestly
Here is where most market articles quietly break. They print a price-to-earnings ratio and a dividend yield that were accurate on the day someone copied them from a screener and are stale by the time you read them, particularly in a year when the index has swung 19 per cent from low to high. This desk will not do that.
What follows instead is the sector trigger, the risk, and the specific valuation test to run on a live NSE or BSE quote page before you commit capital. The test is worth more than the number, because the number changes daily and the test does not.
| Stock | Sector trigger, 2026 | Principal risk | Valuation check to run before buying |
|---|---|---|---|
| HDFC Bank | Industrial credit up 17.5% y-o-y; held firm on a weak financials day | Deposit-cost pressure on margins | Price-to-book against its own 5-year median, not the sector average |
| ICICI Bank | Private banks up 0.51% on 21 Aug while PSUs fell | Credit costs if growth moderates | Return on assets trend across the last four quarters |
| Infosys | Rupee at 95.74 supports export realisations | AI-led cut in discretionary IT spend | Forward P/E against the FY27 guidance actually issued, not consensus |
| HCL Technologies | Gained 1.08% on a red day for the index | Same sector-wide demand question | Dividend yield against the 10-year G-sec at 6.869% |
| Hindalco | Best Nifty gainer as metals rose 1.59% | Commodity cycle reversal | EV/EBITDA at mid-cycle metal prices, not spot |
| JSW Steel | Steel strength in an inflationary commodity tape | Input cost and freight exposure | Net debt to EBITDA before anything else |
| Dr Reddy’s Laboratories | Defensive bid; a Nifty top-five gainer on 24 Aug | US generic pricing pressure | PEG using realistic, not peak, US pipeline growth |
| Larsen & Toubro | Capex cycle visible in Godrej’s ₹20,000 crore Haryana plan | Execution and working capital | Order book to revenue coverage in quarters |
| Power Grid | Yield-defensive leadership on 21 Aug | Regulated return compression | Dividend yield spread over the 10-year G-sec |
| Maruti Suzuki | Auto flagged for a positive Q1 FY27 surprise | Fuel prices hitting discretionary demand | P/E against volume growth, and check inventory days |
The one ratio worth more than P/E right now
With the 10-year G-sec at 6.869 per cent, a risk-free rupee return of nearly 7 per cent is available to anyone. That is the hurdle every equity must clear. A large cap yielding 1.2 per cent with 12 per cent expected earnings growth still beats it comfortably. A slow-growth stock yielding 2 per cent does not, once you adjust for risk. In a year when the index is down 7.31 per cent, comparing every candidate against a 6.869 per cent risk-free alternative filters more bad ideas than any chart pattern will.
Portfolio construction: allocation by risk appetite
Index level alone should never drive allocation. What should drive it is the gap between the return you need and the volatility you can survive without selling at the wrong moment. The four profiles below use the same market facts, weighted differently.
Stock recommendations and levels for today, point by point
These are the desk views and levels published for this session by named research houses. They are observations about where the market is positioned, not a recommendation to transact.
- Treat 24,350 as the switch. LKP Securities identifies it as crucial resistance, above which a meaningful rally can develop. Below it, the range persists.
- Respect 24,200 and 24,000 as the floor. Both were named as supports going into Tuesday. The intraday break of 24,200 on Monday that reversed by the close is a constructive detail.
- Expect an expiry-driven whipsaw. A monthly F&O expiry landing on a sanctions announcement is the definition of a two-way session. Position sizing matters more than direction today.
- Metals retain relative strength. The Nifty Metal index led on both 21 and 24 August. Relative strength that survives two sessions with different index outcomes is usually genuine.
- PSU banks stay hostage to the 10-year. Until the yield stops climbing from 6.869 per cent, the mark-to-market drag persists regardless of loan-book quality.
- IT is a rupee trade before it is a growth trade. Infosys and HCL Technologies rose on 24 August with the rupee at 95.74, even though the sector was the June quarter’s weakest.
- Watch Nvidia and Jackson Hole. Both were flagged as capable of moving global risk appetite in the coming sessions, which reaches India through Nasdaq-linked IT sentiment and EM allocation.
- The 31 August GDP print is the week’s real catalyst. A number near SBI’s 8 per cent and one near ICRA’s 6.4 per cent imply entirely different October MPC expectations.
- Brent above $100 invalidates the base case. Below $90 it fades as a driver. Between the two, the range holds.
- Sensex 77,500 is the mirror level. Moneycontrol’s desk names 24,250 and 77,500 as the immediate resistance zone. A close above both, on volume, is the confirmation to wait for.
Retest risk
Defend
Watch
Range now
Recovery
Trend change
The week ahead: four dates that decide September
Market prediction India: what the targets actually say
Brokerage targets set before the correction and after it differ so widely that quoting only one would be misleading. Nomura cut its December 2026 Nifty target to 24,900 from 29,300, a 15 per cent reduction, citing 10 to 15 per cent risk to FY27 consensus earnings if crude stays elevated. Citi trimmed to 27,000 from 28,500. BNP Paribas, writing in January before the fall, saw 29,500.
Set those against Monday’s 24,219.05 and the implied range for the rest of the year runs from a modest 2.8 per cent gain on Nomura’s number to a 22 per cent gain on BNP’s. That spread is not analyst incompetence. It is an honest reflection of a market whose outcome depends on one variable nobody controls, which is the price of oil.
Frequently asked questions
Why is the Nifty 50 stuck below 24,350 on 25 August 2026?
Because two opposing forces are balanced. Supporting the market: a 5.25 per cent repo rate on hold, FY26 GDP growth of 7.7 per cent, falling unemployment at 5.1 per cent and record domestic SIP flows. Pressing on it: Brent above $90 on Strait of Hormuz risk, a 10-year yield at 6.869 per cent and continued foreign selling. LKP Securities names 24,350 as the resistance that must break before a meaningful rally can start.
What were the Sensex and Nifty closing levels on 24 August 2026?
The BSE Sensex closed at 77,369.11, down 171.72 points or 0.22 per cent. The NSE Nifty 50 closed at 24,219.05, down 32.95 points or 0.14 per cent. Nifty Bank ended near 57,525.95 and India VIX rose 2.90 per cent to 11.525. The Nifty MidCap index gained 0.13 per cent while the SmallCap index lost 0.26 per cent.
What is the current RBI repo rate and when is the next MPC meeting?
The repo rate is 5.25 per cent, held unanimously at the 62nd MPC meeting on 3 to 5 August 2026 with a neutral stance, the fourth consecutive hold. The Standing Deposit Facility is 5.00 per cent and the MSF and Bank Rate are 5.50 per cent. The next MPC meeting is scheduled for 5 to 7 October 2026.
What is India’s latest CPI inflation rate in 2026?
MoSPI reported CPI inflation of 4.45 per cent for July 2026, up from 4.38 per cent in June and 3.93 per cent in May. Rural inflation was 4.84 per cent and urban 3.96 per cent. Food inflation reached 5.52 per cent. The reading remains inside the RBI’s 2 to 6 per cent tolerance band, and the RBI has projected FY27 CPI at 5.0 per cent.
How fast is India’s GDP growing, and what comes next?
FY26 real GDP grew 7.7 per cent, with the March quarter at 7.8 per cent. NSO publishes the Q1 FY27 estimate on 31 August 2026. Forecasts range from ICRA at 6.4 to 6.6 per cent through consensus near 7.2 per cent to SBI Research at 8 per cent. The RBI projects 6.7 per cent for FY27 overall and the World Bank 6.6 per cent.
Are FIIs still selling Indian equities in 2026?
Yes on a year-to-date basis, but the trend softened in August. NSE cash-segment data shows FIIs net sold roughly ₹3.40 lakh crore in 2026 to 18 August while DIIs bought roughly ₹5.17 lakh crore. Depository data puts 2026 FPI equity outflows near ₹2.41 lakh crore. August itself saw about ₹12,921 crore of FPI inflows, a genuine reversal at the margin.
Which sectors are performing best in India in 2026?
Metals led both the 21 and 24 August sessions, rising 1.59 per cent on Monday. Realty was the top-performing index of the June quarter and IT the weakest, hit by AI-driven changes in discretionary technology spending. PSU banks are the current laggards because rising bond yields create mark-to-market losses on their government securities books.
Why did PSU bank stocks fall while metal stocks rose?
They are driven by opposite variables. Rising sovereign bond yields, with the 10-year at 6.869 per cent, reduce the value of the government securities PSU banks hold, producing mark-to-market losses. The same inflationary backdrop that lifts yields also lifts commodity prices, which raises metal company realisations. Bank of Baroda fell 2.2 per cent and Canara Bank 2 per cent on 24 August while Hindalco and JSW Steel led the Nifty higher.
How far is the Nifty from its all-time high?
The Nifty 50 record high is 26,373.20, set on 5 January 2026. From Monday’s close of 24,219.05, the index sits 8.17 per cent below that peak. It is also 9.18 per cent above the 52-week low of 22,182.55 recorded on 2 April 2026, and 7.31 per cent below the 26,129.60 close of calendar 2025.
What should investors watch this week?
Four things in order of impact: the Q1 FY27 GDP release on 31 August, the market’s reaction to fresh US sanctions on Iran and the resulting Brent crude path, today’s monthly F&O expiry, and global cues from Nvidia’s results and the Jackson Hole symposium. Levels to note are 24,200 and 24,000 as support and 24,350 then 24,600 as resistance.
Final Thought
Strip away the noise and 25 August 2026 presents a market with a strong domestic engine and an imported handbrake. The engine is real: 7.7 per cent GDP growth in FY26, 15.6 per cent earnings growth for Nifty 500 companies, unemployment down to 5.1 per cent, labour force participation up to 55.4 per cent, industrial credit growing 17.5 per cent and a repo rate parked at 5.25 per cent with a neutral stance. Very few large economies can show that combination.
The handbrake is Brent above $90 with a Strait of Hormuz risk premium attached, a 10-year yield at 6.869 per cent, a rupee at 95.74 and foreign investors who have withdrawn roughly ₹2.41 lakh crore from Indian equities this calendar year, taking foreign ownership to a 14-year low of 14.7 per cent.
The three numbers worth remembering from this briefing are these. The Nifty is down 7.31 per cent from the 2025 close but up 9.18 per cent from the April low, which means the recovery is real but incomplete. The forecast spread for Friday’s GDP print is 160 basis points wide, from 6.4 to 8.0 per cent, which is unusually large and tells you the economy is genuinely hard to read right now. And a risk-free 6.869 per cent is available in the bond market, which is the hurdle every stock on your watchlist has to beat.
The market is not asking you to predict oil. It is asking whether you have positioned so that being wrong about oil does not force you to sell. That is the only question worth answering before the open.