Why Sensex Erased a 655-Point Rally on 15 September 2026 — and Which Numbers Decide the Next Move
Markets · Daily Briefing · India · September 2026
Why Sensex Erased a 655-Point Rally on 15 September 2026 — and Which Numbers Decide the Next Move
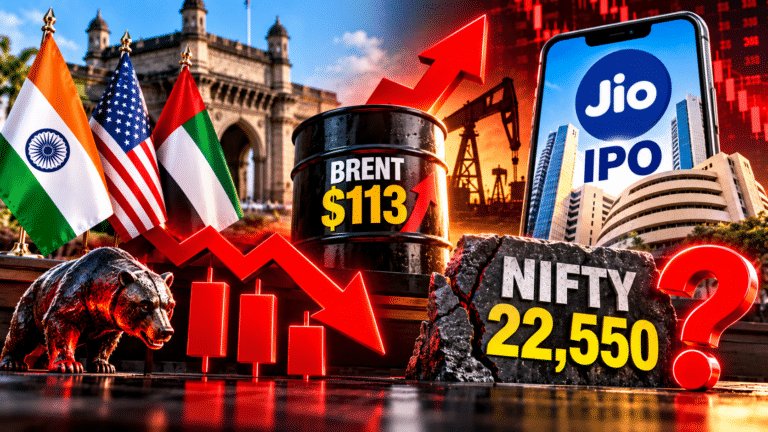
The market opened as though the worst was over. Within minutes of the bell the Sensex was up 655 points and the Nifty had punched through 23,590, carried by a ferocious rally in IT stocks and a relieved bid in HDFC Bank. Six hours later the Sensex closed 777.94 points down. That is a swing of more than 1,430 points from high to close in a single session, and almost none of it was about Indian companies.
Quick Summary
The Sensex settled at 74,003.82, down 777.94 points or 1.04 per cent, and the Nifty 50 at 23,118.60, down 279.50 points or 1.19 per cent, both near the day’s low. Bank Nifty lost 811.80 points to 55,794.75 while the India VIX spiked to 13.27. Foreign investors sold ₹2,977.90 crore of cash equities against domestic buying of ₹2,686.00 crore, the first session in September where the two did not net out positive. IT was the only sector that mattered on the upside; realty and metal led the fall.
The Session in Numbers: How Much Ground Was Actually Lost?
Monday was a market holiday for Ganesh Chaturthi, which matters more than it sounds. It meant Tuesday was the first chance traders had to price in two things that landed over the long weekend: a hotter-than-expected inflation print and a fresh leg up in crude oil.
The opening hour suggested the market had decided to look past both. It had not. Selling built steadily through the afternoon and accelerated into the close.
According to Business Standard’s market report, the Sensex touched an intraday high of 75,436 before reversing, while the Nifty peaked at 23,592. Both indices settled near the bottom of their daily ranges, which is the tell that matters. A market that closes at its low is a market where sellers held the last word.
Where the damage was concentrated
The headline indices understated the day. Mid-caps and small-caps were hit roughly twice as hard as the Sensex, which is the classic signature of institutional risk reduction rather than a routine profit-taking session.
What Actually Broke: Four Pressures That Arrived Together
No single headline explains a 1,432-point round trip. Four separate pressures converged, and each one feeds the others.
Kotak Institutional Equities framed it plainly, noting that the sharp increase in oil prices from the escalation in the West Asia conflict, together with rising global bond yields driven by weakening fiscal positions in developed markets, has overshadowed India’s improved economic and earnings outlook.
That last clause is the uncomfortable part. India’s own numbers are not the problem.
Key Economic Drivers: Is the Domestic Story Still Intact?
GDP growth trajectory: the number that beat every forecast
India’s real GDP expanded 7.8 per cent year on year in the April to June quarter of 2026-27, according to the Ministry of Statistics and Programme Implementation’s release of 31 August 2026. Real GDP at constant prices reached ₹81.36 lakh crore against ₹75.46 lakh crore a year earlier.
The print comfortably exceeded the Reserve Bank’s own projection of 7 per cent for the quarter and a market consensus near 7.1 per cent. Nominal GDP grew 10.3 per cent to ₹88.27 lakh crore, and real gross value added rose 8.2 per cent to ₹73.82 lakh crore.
Underneath the headline, gross fixed capital formation grew 11.9 per cent against 5.8 per cent a year earlier, which points to a genuine investment cycle rather than a consumption-only expansion.
What 7.8 per cent growth means for markets
Growth is not what is dragging the Sensex. At 7.8 per cent, the June quarter was stronger than the preceding year’s 6.9 per cent, and the earnings base for FY27 is improving. The selling is external in origin, which historically makes it faster to reverse than a domestic earnings downgrade cycle.
CPI inflation trend: the print that changed the arithmetic
Retail inflation rose to 4.82 per cent in August 2026 from 4.45 per cent in July, according to the provisional MoSPI release published on 14 September and confirmed by PIB. That is a 20-month high.
Food was the main driver. Consumer food price inflation climbed to 5.95 per cent from 5.52 per cent. More concerning for policymakers, core inflation, which strips out volatile food and fuel, rose to about 4.2 per cent from 3.86 per cent.
A rising core reading is harder to dismiss as a supply shock. It suggests price pressure is broadening.
What the inflation print means for markets
The tolerance band runs from 2 to 6 per cent, so 4.82 per cent is not a breach. But the RBI’s own forecast has inflation peaking at 5.9 per cent in the December quarter, and August came in above the trajectory that assumption implied. That removes the case for a rate cut in the near term and puts a modest hike back on the table if crude stays above $100.
RBI monetary policy: why the repo rate is stuck at 5.25 per cent
The Monetary Policy Committee held the repo rate at 5.25 per cent at its 62nd meeting on 5 August 2026, a unanimous decision, and retained a neutral stance. The same resolution raised the FY27 real GDP forecast to 6.7 per cent and trimmed the FY27 CPI projection to 5.0 per cent.
Governor Sanjay Malhotra described the central bank as neither dovish nor hawkish, and said policy would continue to be guided by headline inflation.
The quarterly detail matters for anyone modelling the next two sessions of the rate cycle.
| RBI projection, FY 2026-27 | Q1 | Q2 | Q3 | Q4 | Q1 FY28 |
|---|---|---|---|---|---|
| Real GDP growth | 7.0% | 6.4% | 6.5% | 6.8% | 7.3% |
| Actual GDP delivered | 7.8% | Due 30 Nov | Not due | Not due | Not due |
| Headline CPI inflation | Passed | 4.7% | 5.9% | 5.5% | 5.3% |
| Policy repo rate | 5.25% | 5.25% | Next call 7 Oct | Open | Open |
| Full-year forecast | GDP 6.7 per cent, CPI 5.0 per cent, core CPI 4.3 per cent, neutral stance retained | ||||
What the rate hold means for markets
The next MPC meeting runs from 5 to 7 October 2026. With August CPI already at 4.82 per cent and the RBI’s own Q3 peak pencilled at 5.9 per cent, the realistic range of outcomes has narrowed to a hold or a small hike. Rate-sensitive sectors, which is exactly where realty and NBFC selling concentrated on Tuesday, are pricing that shift.
Employment data: the quiet number nobody traded
India’s unemployment rate eased to 5.00 per cent in August 2026 from 5.10 per cent in the preceding month, based on the Periodic Labour Force Survey series. On its own the move is small and within normal monthly variation.
It did, however, remove one possible argument for monetary easing. A labour market that is not deteriorating gives the MPC less reason to look through an inflation overshoot.
What steady employment means for markets
A stable jobs picture alongside 7.8 per cent growth and rising core inflation is the combination that argues for rates staying where they are. For equity investors the practical read is that the discount rate applied to Indian earnings is unlikely to fall this calendar year.
Nifty Today, Point by Point: The Levels That Now Matter
Stripped of narrative, here is the Nifty 50 session as a set of numbers a trader can work from.
- Previous close, 11 September: 23,398.10
- Open, 15 September: 23,576.15, a gap up of 178.05 points
- Intraday high: 23,592, up 194 points or 0.83 per cent at its best
- Close: 23,118.60, down 279.50 points or 1.19 per cent, near the session low
- High-to-close give-back: 473 points inside one session
- 52-week range: 22,182.55 low to 26,373.20 high
- Distance below the 52-week high: about 12.3 per cent
- India VIX: 13.27, up 7.99 per cent from 12.29, with an intraday high of 13.59
On the derivatives side, the put-call ratio and the maximum call and put open interest strikes for the current expiry are data awaited at the time of writing. We do not publish option-chain figures we have not verified against the exchange.
Breakdown
Defend
Repair
Reclaim
Trend back
The verdict from the chart is straightforward. A gap-up open that is fully retraced and closes at the low is a bearish engulfing signature, and it leaves 23,592 as a level the market has now failed at once. Until that is taken out on a closing basis, rallies are suspect.
September 2026 So Far: How Bad Has the Month Been?
Both benchmarks have fallen more than 3.5 per cent in September, with the Sensex shedding roughly 2,900 points. Here is the month framed against longer horizons.
| Measure | BSE Sensex | NSE Nifty 50 | Reference date |
|---|---|---|---|
| Close, 11 September 2026 | 74,781.76 | 23,398.10 | Previous session |
| Close, 15 September 2026 | 74,003.82 | 23,118.60 | Session under review |
| Single-day change | -777.94 points, -1.04% | -279.50 points, -1.19% | 15 September |
| September so far | About -2,900 points, more than -3.5% | More than -3.5% | 1 to 15 September |
| One-month change | -4.79% | -4.81% | To 15 September |
| One-year change | -10.17% | -8.40% | To 15 September |
| 52-week high | 86,159.02 (December 2025) | 26,373.20 | Past 12 months |
| 52-week low | 71,545.81 | 22,182.55 | Past 12 months |
Two readings stand out. First, the Sensex has given up 10.17 per cent over twelve months while the Nifty has lost 8.40 per cent, meaning the thirty-stock index has borne more damage than the fifty-stock one. That is heavyweight concentration working against the Sensex.
Second, at 74,003.82 the Sensex sits only about 3.4 per cent above its 52-week low of 71,545.81. The cushion is thinner than the headline numbers suggest.
Global Cues: Which Foreign Markets Set the Tone?
Indian equities did not fall in isolation. Every major European index lost about 1 per cent in the same 24 hours, and Wall Street closed lower ahead of the Federal Reserve decision.
| Global index | Close | Change % | Read-through for India |
|---|---|---|---|
| Dow Jones Industrial Average | 52,421.20 | -0.29% | Mild risk-off ahead of the Fed |
| S&P 500 | 7,619.98 | -0.48% | Sets the global equity risk premium |
| Nasdaq Composite | 26,186.41 | -0.56% | Weak tech tape did not stop Indian IT |
| CBOE VIX | 17.76 | +3.86% | Rising global fear gauge, mirrored by India VIX |
| Nikkei 225 | 63,484.10 | -0.01% | Flat, offered no directional lead |
| Hang Seng | 24,664.22 | -1.02% | Asian risk appetite deteriorating |
| Shanghai Composite | 3,864.28 | -0.54% | China demand signal for metals |
| FTSE 100 | 10,592.81 | -0.98% | Energy-heavy index still fell despite oil |
| DAX | 25,193.67 | -0.97% | Bond-yield sensitivity on display |
| CAC 40 | 8,036.92 | -1.00% | European fiscal concerns in the price |
| GIFT Nifty | Data awaited | Data awaited | Verified close not available at publication |
The commodity and rates table is where the real pressure shows up.
| Asset | Level | Change | Why it moved Indian equities |
|---|---|---|---|
| Brent crude | $108.47 | +2.64% | Traded near $107.7 during the Indian session; raises the import bill |
| WTI crude | $105.43 | +3.98% | Confirms the move is supply-driven, not a spread artefact |
| US 10-year Treasury | 5.006% | Above the 5% line | Raises the global discount rate on equities |
| India 10-year G-sec | 7.095% | +8.6 basis points | Near a four-month high, pressuring rate-sensitive stocks |
| US Dollar Index | 99.662 | +0.27% | Dollar strength drains emerging-market flows |
| USD/INR | 95.92 at the Indian close | About -0.4% | Weakest in over a month; helps IT, hurts importers |
| Gold | $4,292.30 | -0.16% | Did not rally, consistent with a rate-driven selloff |
The mechanism worth understanding
Expensive crude and a weak rupee compound each other. India buys most of its oil in dollars, so a barrel at $108 with the rupee at 95.92 costs about ₹10,353 against roughly ₹9,000 when Brent was near $95 and the rupee near 94.7. That arithmetic flows into the import bill, the current account, fuel prices and eventually the CPI basket that the RBI is already watching.
Sector Performance: Why IT Was the Only Place to Hide
Realty and metal were the worst-performing sectoral indices, with chemical shares also weighing on the tape. Nifty Realty fell 4.04 per cent, the steepest sectoral decline of the session.
Technology went the other way, and for a reason that is mechanical rather than sentimental. Indian IT majors earn the bulk of their revenue in dollars and book costs in rupees, so a falling rupee lifts reported margins.
Top gainers on the Nifty 50
| Stock | Change % | Close where reported | Reason for the move |
|---|---|---|---|
| HCL Technologies | +4.0% | ₹1,253.70 | Expanded CrowdStrike partnership; rose as much as 7 per cent intraday |
| Infosys | +3.8% | ₹1,077.00 | Rupee weakness and a reassessment of AI disruption risk |
| Tata Consultancy Services | +2.3% | ₹2,251.00 | Sector-wide re-rating of export earnings |
| Tech Mahindra | +2.3% | ₹1,575.90 | Followed the large-cap IT bid |
| Wipro | +1.6% | Data awaited | Currency tailwind on dollar revenue |
| ONGC | +1.5% | Data awaited | Direct beneficiary of higher crude realisations |
| HDFC Bank | +1.2% | ₹716.60 | Two succession candidates submitted to the RBI |
| Tata Motors Passenger Vehicles | +0.8% | Data awaited | Held up against a weak auto tape |
| Hindustan Unilever | +0.6% | ₹1,947.80 | Defensive rotation into staples |
| Tata Steel | +0.4% | Data awaited | Closed green despite metal being a losing sector |
Top losers on the Nifty 50
| Stock | Change % | Close where reported | Reason for the move |
|---|---|---|---|
| Bharat Electronics | About -6.0% | Data awaited | Analysts flagged downside risk for defence valuations |
| Bajaj Finserv | -2.75% | Data awaited | NBFC selling on the rate-hike repricing |
| Asian Paints | -2.53% | Data awaited | Crude-linked input cost pressure |
| Titan Company | -2.49% | ₹4,885.00 | Discretionary demand sensitivity |
| Larsen & Toubro | -2.25% | ₹3,842.30 | Capital goods hit by higher domestic yields |
| ICICI Bank | -1.73% | ₹1,355.50 | Broad banking weakness dragged Bank Nifty down 1.43 per cent |
| Reliance Industries | -1.47% | ₹1,239.00 | Heaviest single drag on the index by weight |
| Maruti Suzuki | -1.04% | ₹12,271.00 | Fuel-price pass-through risk to demand |
| Bharti Airtel | -0.38% | ₹1,824.20 | Mild profit-taking in a defensive name |
| Sun Pharmaceutical | -0.11% | ₹1,838.00 | Pharma nearly flat, outperforming the index |
Shriram Finance, Adani Enterprises, Adani Ports, InterGlobe Aviation, Mahindra and Mahindra, State Bank of India and Grasim Industries were also named among the prominent laggards.
Institutional Flows: The Number That Changed on Tuesday
For most of September the pattern was stable and reassuring. Foreign investors sold, domestic institutions bought more than the foreigners sold, and the net institutional bid stayed positive. On 15 September that broke.
| Session | FII net, ₹ crore | DII net, ₹ crore | Combined, ₹ crore | Domestic cover ratio |
|---|---|---|---|---|
| 3 September | -2,345.87 | +4,977.46 | +2,631.59 | 2.1 times |
| 4 September | -3,111.94 | +8,930.12 | +5,818.18 | 2.9 times |
| 7 September | +280.13 | +566.76 | +846.89 | Both buyers |
| 8 September | -123.19 | +1,349.64 | +1,226.45 | 11.0 times |
| 9 September | -582.99 | +1,509.04 | +926.05 | 2.6 times |
| 10 September | -438.24 | +1,025.85 | +587.61 | 2.3 times |
| 11 September | -930.90 | +1,968.17 | +1,037.27 | 2.1 times |
| 15 September | -2,977.90 | +2,686.00 | -291.90 | 0.9 times |
The arithmetic behind the claim
Across those eight sessions foreign investors sold a net ₹10,230.90 crore of Indian cash equities while domestic institutions bought ₹23,013.04 crore, a combined net inflow of ₹12,782.14 crore. On 15 September alone, DII buying of ₹2,686.00 crore covered only 90 per cent of FII selling of ₹2,977.90 crore, leaving the first negative net institutional day of the month at minus ₹291.90 crore. Figures are Dailyfinancial.in calculations from exchange-reported daily provisional cash-market data.
That 0.9 times cover ratio is the single most useful number in this article. Domestic mutual fund and insurance flows have been the floor under this market all month. The moment that floor stops absorbing foreign selling, index declines stop being orderly.
Market News Highlights: Eight Items That Moved the Tape
- August CPI at 4.82 per cent. Released on 14 September, a market holiday, so the entire reaction landed in Tuesday’s session. Hit rate-sensitive sectors hardest, with realty down 4.04 per cent.
- Brent crude above $107. Attacks on Saudi energy infrastructure drove supply fears. Benefited ONGC, hurt paints, aviation, tyres and other crude-linked input users.
- US 10-year Treasury yield through 5 per cent. Raised the global cost of capital and the relative appeal of dollar fixed income, pressuring emerging-market equity valuations.
- Rupee at 95.92 per dollar. The weakest level in over a month, with traders reporting dollar sales through state-run banks linked to the RBI. Positive for IT exporters, negative for importers.
- HCLTech and CrowdStrike expand their partnership. The tie-up integrates CrowdStrike security technology with HCLTech’s AI security and resilience services. The stock rose as much as 7 per cent intraday before closing 4 per cent higher.
- HDFC Bank submits two succession candidates to the RBI. Clarity on the leadership transition lifted the stock 1.2 per cent to ₹716.60, one of the few green financials.
- Bharat Electronics falls about 6 per cent. Analyst warnings on downside risk to defence-sector valuations made it the worst Nifty 50 performer and dragged the wider defence complex.
- India’s August exports rise 26 per cent to $43.81 billion. The trade deficit narrowed, a genuine positive for the rupee that was entirely overwhelmed by the oil and yield story on the day.
What to Watch in the Next Session
The Federal Reserve announced its policy decision on 16 September, after the Indian close. That single event reorders everything below it.
What disciplined investors do in a session like this
The Short Version
Indian equities opened 655 Sensex points higher on 15 September 2026 and closed 777.94 points lower, a 1,432-point round trip driven almost entirely by external variables. Brent above $107, the US 10-year through 5 per cent, the rupee at 95.92 and an August CPI print of 4.82 per cent together repriced the discount rate applied to Indian earnings. IT was the only sector that gained, and it gained for a currency reason rather than a demand reason. The domestic picture, with 7.8 per cent GDP growth and a narrowing trade deficit, remained intact throughout. The number worth carrying into the next session is not the index level but the institutional cover ratio, which fell below 1.0 for the first time this month.
Frequently Asked Questions
Why did the Sensex erase a 655-point rally on 15 September 2026?
The morning rally was driven by IT stocks and HDFC Bank. It reversed when traders priced in Brent crude above $107, the US 10-year Treasury yield crossing 5 per cent, the rupee weakening to 95.92 and an August CPI print of 4.82 per cent released during Monday’s holiday. The Sensex closed 777.94 points down at 74,003.82.
What was the Sensex and Nifty closing level today?
For the session of Tuesday, 15 September 2026, the BSE Sensex closed at 74,003.82, down 777.94 points or 1.04 per cent. The NSE Nifty 50 closed at 23,118.60, down 279.50 points or 1.19 per cent. Bank Nifty settled at 55,794.75, lower by 811.80 points or 1.43 per cent.
Why did IT stocks rise when the whole market was falling?
Indian IT majors earn most revenue in dollars and incur costs in rupees, so a weaker rupee raises reported revenue and margins. With the rupee at 95.92, HCL Tech gained 4 per cent, Infosys 3.8 per cent and TCS 2.3 per cent. HCLTech had an additional trigger in its expanded CrowdStrike partnership.
What is the current RBI repo rate and when is the next policy meeting?
The repo rate is 5.25 per cent, held unanimously at the August 2026 MPC meeting with a neutral stance. The RBI projects FY27 GDP growth at 6.7 per cent and CPI inflation at 5.0 per cent. The next Monetary Policy Committee meeting is scheduled for 5 to 7 October 2026.
Is CPI inflation at 4.82 per cent a problem for the stock market?
It is not a breach of the 2 to 6 per cent tolerance band, but it is a 20-month high and above the trajectory the RBI’s own forecast implied. Core inflation rising to about 4.2 per cent from 3.86 per cent matters more, because a broadening of price pressure is harder to dismiss as a temporary food or fuel shock.
How much have FIIs sold in September 2026 so far?
Across the eight sessions from 3 to 15 September, foreign investors sold a net ₹10,230.90 crore of cash equities while domestic institutions bought ₹23,013.04 crore. The combined net was a positive ₹12,782.14 crore. On 15 September alone the combined figure turned negative at minus ₹291.90 crore.
How far is the Sensex from its all-time high?
The Sensex record high is 86,159.02, set in December 2025. At Tuesday’s close of 74,003.82 the index is about 14.1 per cent below that peak. It is also only about 3.4 per cent above its 52-week low of 71,545.81, which is a thinner cushion than the headline decline suggests.
Which Nifty levels should traders watch in the next session?
Tuesday’s close of 23,118.60 sits at the top of the 22,900 to 23,120 defence band. Reclaiming the 11 September close of 23,398.10 would neutralise the fall, while clearing 23,592, the level Tuesday’s rally failed at, would change the September structure. Below 22,900 opens the path toward the 22,182.55 low.
Is India’s economic growth still strong despite the market fall?
Yes. Real GDP grew 7.8 per cent in the April to June quarter of FY27, above the RBI’s 7 per cent projection, with gross fixed capital formation up 11.9 per cent. August exports rose 26 per cent to $43.81 billion and the trade deficit narrowed. The selling pressure has been external rather than domestic in origin.
Why did mid-cap and small-cap stocks fall harder than the Sensex?
The Nifty Midcap 100 fell 2.12 per cent and the Smallcap 100 fell 2.43 per cent, their steepest single-day declines since 12 May 2026, against 1.04 per cent for the Sensex. Broader-market stocks carry higher valuations and thinner liquidity, so they absorb the most damage when institutions reduce risk exposure.