Why Is the Sensex Falling on 7.8% GDP Growth — and Which Nifty Level Decides What Happens Next?
Markets · India Equities · Session brief for Thursday, 20 August 2026
Why Has Nifty Fallen for Seven Sessions Straight — and Which Stocks Look Buyable at 24,078?
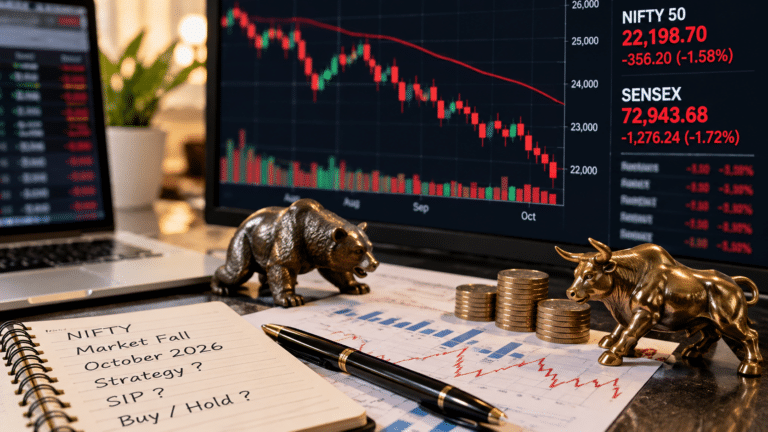
You opened your portfolio app this morning and the red has stopped feeling like noise. Seven consecutive sessions of Nifty declines will do that. The index closed at 24,078.30 on Wednesday, the Sensex at 76,909.68, and somewhere in the middle of that slide the story quietly changed from “healthy correction” to “what exactly is breaking?”
Here is the honest answer, and it has two halves. Nothing is breaking inside India. The economy just posted its fastest full-year growth in years, corporate profits just delivered their best quarter in more than two years, and the central bank is comfortable enough to sit still. What is breaking is the price of oil and the price of money abroad. Brent above $91 a barrel and a 30-year US Treasury yield at levels last seen in 2007 are a specific, mechanical problem for an economy that imports most of its crude and competes for the same global capital.
This briefing separates the two. Below you will find where every index closed, what moved, which foreign markets set the tone overnight, what the macro data actually says, and how a diversified investor should think about a market whose fundamentals and price action are pointing in opposite directions.
Quick Summary
The Nifty 50 has fallen for seven straight sessions, its longest losing run in nearly a year, shedding 2.1% over that stretch to close at 24,078.30. The cause is external, not domestic: Brent crude near $92, a rupee at 95.68 to the dollar, and rising developed-market bond yields pulling money away from emerging markets. Domestic fundamentals point the other way, with FY26 GDP growth at 7.7%, Q1 FY27 Nifty profit growth at a 10-quarter high of 18%, and the repo rate held at 5.25%. GIFT Nifty at 24,219 points to a mildly positive open on Thursday.
Indian Market Overview: Where Sensex, Nifty and Bank Nifty Actually Stand
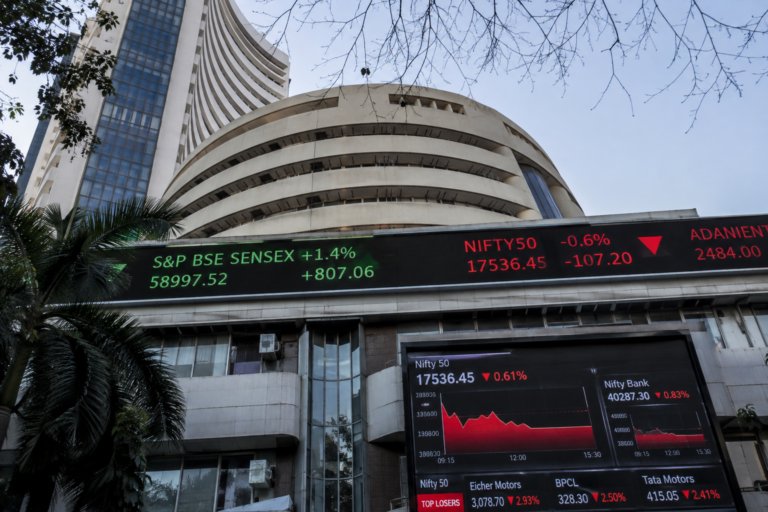
Wednesday, 19 August, was the seventh consecutive down session for the Nifty 50 and the sixth decline in seven sessions for the Sensex. Both benchmarks have surrendered 2.1% across that run. What makes the sequence unusual is not its depth, which is modest by historical standards, but its persistence. The Nifty has not strung together seven red sessions in nearly a year.
Read those four numbers together and a picture emerges that headlines miss. The benchmarks are falling, but the volatility index is sitting at 11.32 and drifting lower. Markets in genuine distress do not behave like this. A VIX in the low double digits alongside a seven-session decline describes an orderly, grinding de-rating driven by flows and macro arithmetic, not a panic driven by fear of an event.
What the market breadth is really saying
Beneath the index level, the selling was broad. Roughly 1,725 shares advanced while 2,386 declined and 179 finished unchanged, a decline-to-advance ratio of about 1.4 to 1. The mid-cap index slipped 0.2% and the small-cap index fell 0.5%, meaning the broader market underperformed the large-cap benchmarks yet again.
That combination matters. When small and mid caps fall harder than the Nifty during a correction driven by global factors, it usually reflects domestic investors trimming risk at the margin rather than foreign investors dumping index heavyweights. The flow data supports that reading, and we will come to it shortly.
Bank Nifty: the index that refused to break
The single most encouraging number on the board is the Nifty Bank close of 57,239.75, down a fractional 0.04%. In a session where the benchmark fell 0.32% and energy and defence stocks were dumped, banks essentially held the line. Financials as a group slipped 0.4%, led lower by ICICI Bank at 0.71% and Axis Bank at 0.64%, while Kotak Mahindra Bank closed 0.67% higher.
Banking is the largest weight in the Nifty by a distance. A correction that leaves the banking index nearly flat is structurally different from one that takes financials down with it. This is the market repricing oil sensitivity and global liquidity, not repricing Indian credit quality.
Nifty Today in Detail: The Ten Numbers That Define This Session
For readers who want the session distilled rather than described, here is Thursday morning’s board, point by point.
- Nifty 50 spot: 24,078.30, down 76.60 points or 0.32% on Wednesday, closing below the psychologically watched 24,100 mark for the first time in this decline.
- Seven-session damage: 2.1%. The Nifty fell from roughly 24,595 to 24,078 across the run, a loss of about 517 points, which is a shallow drawdown by any standard.
- GIFT Nifty at 24,219.00 as of 6:53 AM IST on 20 August, up 0.08% from its previous close of 24,198.50, with an intraday band of 24,196.50 to 24,219.00. That points to a flat-to-mildly-positive open.
- Implied gap: roughly 140 points above spot. Traders should treat this as directional guidance rather than a forecast, because domestic order flow at 9:15 AM regularly overrides the offshore signal.
- India VIX at 11.3225, down 0.59%. Option premiums are cheap, which favours buyers of protection and penalises sellers of volatility if a shock arrives.
- Nifty Bank at 57,239.75, effectively unchanged, and the clear relative-strength leader among the major indices this week.
- Nifty valuation: a P/E of 20.36 as of 19 August against a ten-year median near 23.4, with a price-to-book of 2.93 and a dividend yield of 1.18%. On trailing earnings, this is the cheapest the index has looked in some time.
- Only one major sector closed green. The IT index rose 0.7% after falling 4% across the previous three sessions, a bounce off oversold conditions rather than a change of trend.
- Rupee at 95.68 to the US dollar after slipping 7 paise, pressured by the crude import bill and by capital being pulled towards higher developed-market yields.
- Immediate technical zone: 24,000. It is a round number, it sits close to the recent consolidation floor, and it is where derivative positioning has clustered. A decisive close below it changes the short-term character of this market; a defence of it does the opposite.
The one thing worth noticing
A seven-session decline of 2.1% works out to an average daily loss of about 0.3%. That is not a sell-off. It is attrition. Attrition markets are dangerous mainly because they exhaust investors into selling at the bottom of a range, not because they signal a structural problem.
BSE Sensex vs NSE Nifty 50: The August 2026 Session-by-Session Comparison
The two benchmarks have not fallen in lockstep, and the gap between them is informative. The Sensex, with its narrower 30-stock construction and heavier weighting toward a handful of index giants, has taken slightly more damage than the broader Nifty during this stretch.
| Session | Sensex close | Sensex change | Nifty 50 close | Nifty change | Session driver |
|---|---|---|---|---|---|
| Fri, 7 Aug | 78,499.17 | down 455 pts | Below 24,600 | Negative | Financial-led selloff after the RBI policy week |
| Mon, 17 Aug | 77,728.16 | Negative | 24,287.65 | Negative | IT stocks and consumer durables drag; metals and realty gain |
| Tue, 18 Aug | 77,235.46 | down 492.70 pts | 24,154.90 | down 132.75 pts | Brent tops $91; US-Iran ceasefire lapses; FCNR(B) swap closed early |
| Wed, 19 Aug | 76,909.68 | down 0.42% | 24,078.30 | down 0.32% | Crude near $92, global yields rise, defence and energy sold |
| Thu, 20 Aug (pre-open) | Awaiting open | Flat to positive | GIFT at 24,219.00 | up 0.08% | Bargain buying attempt; weak Asia and firm crude cap the upside |
| Run total | Six down in seven | down 2.1% | Seven straight | down 2.1% | Longest Nifty losing streak in nearly a year |
Closes for 7, 18 and 19 August are as reported from NSE and BSE data. The 17 August figures are computed from the consecutive-session point changes reported for 18 August and should be treated as derived rather than as a primary quote.
Two details in that table deserve a second look. First, the divergence on 18 August: the Sensex lost 0.63% while the Nifty lost 0.55%, a gap that widens when heavyweight index constituents such as Reliance and the large private banks are the ones being sold. Second, the pattern of the decline itself. Each successive down day has been smaller than the last, from 492 points on the Sensex to 326 points. Decelerating declines into a support zone are how consolidations typically end, though they are never a guarantee.
Latest News Highlights: Eight Stories Moving Indian Markets Right Now
A market that falls for seven sessions is rarely responding to one thing. Here is what has actually been driving the tape, and the transmission mechanism for each.
- Brent crude near $92 a barrel. Prices climbed after the US President said no talks were under way with Iran, extinguishing near-term hopes of resolution in West Asia. For India, which imports the overwhelming majority of its crude, this is the single most damaging headline on the board. It widens the import bill, weakens the rupee, feeds into transport and food inflation, and compresses margins for every oil-consuming manufacturer. The immediate market impact was a 1.2% fall in the energy index and sustained pressure on the benchmarks.
- Uncertainty around the Strait of Hormuz. The chokepoint through which a large share of seaborne oil moves has become a live supply risk rather than a theoretical one. This is why the crude move has stickiness that a normal demand-driven rally would not have, and why oil-linked inflation forecasts for September have been revised upward.
- Rising global bond yields. Long-term borrowing costs in the United States, Germany and Japan have all pushed higher. The 30-year US Treasury yield touched its highest level since 2007, while the 10-year sits near its highest since January 2025. When a risk-free developed-market bond pays more, the relative case for emerging-market equities weakens mechanically, without anyone forming a negative view on India specifically.
- The RBI closed its special FCNR(B) swap facility a month ahead of schedule. Announced earlier in the week, this weighed directly on large lenders, with Kotak Mahindra Bank, SBI, ICICI Bank and HDFC Bank all posting losses in the 0.5% to 1.1% band on the day. It signalled that the central bank felt dollar inflows were sufficient without extending the support window.
- Shiprocket’s blockbuster listing. The logistics platform jumped 35% on debut after a strong response to its initial public offering. In a week of index weakness, the primary market delivered exactly the opposite message about domestic risk appetite, which is worth holding on to.
- City gas distribution incentives. The government announced incentives for city gas distributors to expand domestic piped cooking-gas connections. Indraprastha Gas rose 2.2% and Mahanagar Gas 1.5% on the news, a reminder that policy tailwinds still produce clean, identifiable winners inside a falling market.
- Prism Johnson’s coal supply win. The stock gained 5% after securing ten-year coal-supply contracts worth ₹70.49 crore annually from Eastern Coalfields and South Eastern Coalfields. Long-tenure input security is being repriced upward at a moment when input costs are the market’s central anxiety.
- Corporate governance in focus. Tata Sons postponed its annual general meeting days after chairman N Chandrasekaran announced his exit, an event with no direct index impact but considerable weight in how institutional investors think about the group’s listed entities over the coming quarters.
The transmission chain worth memorising
Crude up, then rupee down, then imported inflation up, then RBI’s room to cut narrows, then bond yields firm, then equity valuations compress. Every stage of that chain is currently active. Break the first link and the whole sequence reverses within weeks. That is why oil, and not earnings, is the variable to watch this month.
Foreign Indices That Moved Dalal Street Overnight
Indian markets no longer open in isolation. The GIFT Nifty absorbs roughly 21 hours of global news before the NSE bell, which means the first fifteen minutes of every Indian session are largely an argument the rest of the world has already had.
| Index | Market | Latest level | Change | Read-across for India |
|---|---|---|---|---|
| Dow Jones | United States | 53,348.68 | down 0.27% | Broad risk appetite mildly negative; industrials soft |
| Nasdaq Composite | United States | 26,300.46 | down 1.38% | The key one for Nifty IT; tech weakness usually lands here next day |
| S&P 500 | United States | 7,710.24 | down 0.74% | Yield-driven de-rating, not an earnings problem |
| Nikkei 225 | Japan | 67,460.73 | down 2.54% | Sharpest Asian fall; rising JGB yields pressure the carry trade |
| Hang Seng | Hong Kong | 25,471.15 | up 0.07% | Stable; China flows not currently competing for India’s allocation |
| FTSE 100 | United Kingdom | 10,724 | down 0.03% | Energy-heavy index cushioned by high crude |
| DAX | Germany | 26,102 | down 0.11% | Bund yields rising alongside Treasuries |
| CAC 40 | France | 8,541 | up 0.37% | Best major European performer overnight |
| STOXX 50 | Eurozone | 6,474 | up 0.09% | Marginally positive; Europe less oil-sensitive than India |
| GIFT Nifty | GIFT City | 24,219.00 | up 0.08% | Points to a flat-to-mildly-positive Indian open |
The Nikkei’s 2.54% drop is the number to sit with. Japan’s long bond yields rising is not a Japanese story; it is the unwinding of a global funding trade that has quietly financed risk assets everywhere, including emerging Asia. When Japanese yields rise, capital that had been borrowed cheaply in yen and deployed abroad starts coming home. India feels that as foreign portfolio outflows on days when nothing domestic has changed.
The Nasdaq’s 1.38% fall maps directly onto Indian IT services, which is why Wednesday’s 0.7% gain in the Nifty IT index is better understood as a bounce off a 4% three-session slide than as a genuine reversal.
Key Economic Drivers: GDP, Inflation, Repo Rate and Jobs
Now the part that contradicts the price action. India’s macro data over the past three months has been, on almost every measure, better than the market’s behaviour implies.
GDP growth: the strongest full year in the current series
The Ministry of Statistics and Programme Implementation released provisional estimates on 5 June 2026 showing real GDP growth of 7.7% for FY 2025-26, up from 7.1% the previous year and ahead of the 7.6% second advance estimate. Real GDP reached ₹323.12 lakh crore against ₹299.89 lakh crore in FY25, with nominal GDP at ₹346.36 lakh crore, growing 8.9%.
Apr-Jun 25
Jul-Sep 25
revised
Jan-Mar 26
full year
RBI forecast
The composition matters more than the headline. Manufacturing expanded 10.7% in FY26 against 9.3% the year before. The contact-intensive services block covering trade, hotels, transport and communication accelerated to 11% from 6.6%. Private final consumption expenditure quickened to 7.7% from 5.8%, and gross fixed capital formation, the investment proxy, grew 8.2% for the year with a Q4 reading of 10.8%, a thirteen-quarter high.
The soft spot is agriculture, which decelerated to 3.0% from 4.2%, and that vulnerability is directly relevant right now given El Niño risk to the southwest monsoon. Per capita GDP at constant prices reached ₹2,27,065, up 6.6%.
CPI inflation: a 19-month high, but the wrong kind of high
Retail inflation rose to 4.45% in July 2026 from 4.38% in June, the highest reading since December 2024, according to National Statistics Office data released on 12 August. It has climbed steadily every month from 2.74% in January. Rural inflation ran at 4.84% against urban at 3.96%, and consumer food price inflation reached 5.52% from 5.32%.
Look at the shape of that chart and the RBI’s calm becomes legible. Housing inflation at 2.22% and urban headline below 4% are not the fingerprints of an overheating economy. The pressure is concentrated in food, fuel-linked services and precious metals, which are supply and geopolitics stories, not demand stories. Potato prices were in outright deflation at minus 16.56%, tomatoes fell 4.59% and motor cars declined 6.72%.
Regionally, southern states led the table, with Telangana at 6.32%, Andhra Pradesh at 5.72%, Tamil Nadu at 5.44%, Madhya Pradesh at 4.91% and Karnataka at 4.89%, differences economists attribute to stronger demand, higher logistics costs and local levies.
RBI repo rate: holding at 5.25% with a deliberately flexible message
At the 62nd meeting of the Monetary Policy Committee, held from 3 to 5 August 2026, all six members voted unanimously to hold the repo rate at 5.25%. The standing deposit facility stays at 5.00% and the marginal standing facility and Bank Rate at 5.50%, with the stance retained at neutral.
The interesting part was not the decision but the forecast revisions. The RBI raised its FY27 real GDP growth projection from 6.6% to 6.7% while cutting its inflation estimate by 10 basis points to 5.0%, projecting core inflation at 4.3%. Governor Sanjay Malhotra described the central bank as “neither dovish nor hawkish” and said headline inflation should peak in the third quarter of 2026-27 before moderating. The next policy meeting is scheduled for 5 to 7 October 2026.
Cut window
Comfortable hold
Watchful hold
Hawkish tilt
Hike risk
Economists expect the reading to harden further. ICRA’s chief economist Aditi Nayar projects CPI at 4.7% in August and above 5% in September as the base effect turns unfavourable, with the full-year average landing near 5% largely because of the prolonged West Asia conflict and monsoon risk. That trajectory pushes India from the amber zone into the orange one, which is precisely the migration a bond market prices in before an equity market does.
Employment: the quietly excellent number nobody traded on
The NSO released the sixteenth monthly Periodic Labour Force Survey bulletin on 17 August 2026. The unemployment rate for persons aged 15 and above fell to 5.1% in July from 5.5% in June. Rural unemployment dropped sharply to 4.5% from 5.0%, while urban unemployment was steady at 6.7% against 6.6%. Compared with July 2025, urban unemployment improved by half a percentage point from 7.2%.
The labour force participation rate is the more meaningful figure. It rose to 55.4% from 54.4%, with rural participation jumping 1.4 percentage points to 58.0%. Female participation climbed from 32.7% to 34.4% overall, with rural female participation at 38.8% and urban at 25.3%. The estimates draw on 3,71,021 people surveyed nationwide.
Why a falling jobless rate with rising participation is the rare good signal
Unemployment usually falls for a bad reason: discouraged workers leave the labour force, shrinking the denominator. Here the opposite happened. The labour force grew by a full percentage point of participation and unemployment still fell 0.4 points. Do the arithmetic and it means the economy absorbed the new entrants and then some. For consumption-facing companies, from two-wheelers to entry-level financial services, that is the cleanest demand signal in the current data set.
Institutional Flows: Who Has Actually Been Buying This Dip
The received wisdom is that foreign investors are dumping India. The data disagrees, and this is where the market narrative has been lazy.
| Date, August 2026 | FII net (₹ crore) | DII net (₹ crore) | Combined | Reading |
|---|---|---|---|---|
| 18 Aug | +1,651.50 | +2,579.30 | +4,230.80 | Both sides buying into weakness |
| 17 Aug | -2,535.10 | +5,101.50 | +2,566.40 | Heaviest domestic absorption of the month |
| 14 Aug | +508.10 | +356.40 | +864.50 | Thin, pre-weekend flows |
| 13 Aug | -510.70 | +4,353.10 | +3,842.40 | Domestic funds outbuying foreigners 8 to 1 |
| 12 Aug | -1,002.50 | +5,841.70 | +4,839.20 | Largest DII print of the month |
| 11 Aug | +258.60 | +24.80 | +283.40 | Balanced but negligible |
| 10 Aug | +1,974.80 | -1,290.30 | +684.50 | Rare reversal: foreigners bought, locals sold |
| 5 Aug | -943.40 | +2,883.20 | +1,939.80 | RBI policy day; domestic conviction held |
Foreign portfolio investors bought Indian shares worth ₹11,347.65 crore in August through 18 August. That is net buying, in the middle of a seven-session decline, from precisely the investor class the headlines say is fleeing. What has actually happened is that domestic institutions have become the market’s shock absorber, posting net purchases on nine of the ten sessions listed above, including five days above ₹2,500 crore.
This is the structural change of the past few years and it deserves more attention than it gets. A market where domestic mutual fund and insurance flows can absorb ₹2,500 crore of foreign selling in a single session without the index breaking is a fundamentally different market from the one that existed a decade ago.
Top 10 Gainers on 19 August 2026
The gainers list tells you exactly where the rotation is going: technology, pharmaceuticals, metals and select consumption. Every one of these is either a dollar earner benefiting from a weak rupee or a company with input-cost insulation.
| # | Stock | Close (₹) | Change | Why it moved |
|---|---|---|---|---|
| 1 | HCL Technologies | 1,324.80 | +2.06% | Led the IT bounce after a 4% three-session sector slide; rupee at 95.68 lifts dollar revenue translation |
| 2 | JSW Steel | 1,285.80 | +1.44% | Metals momentum intact after 96% Q1 FY27 profit growth on better realisations |
| 3 | Sun Pharmaceutical | 1,900.00 | +1.33% | Defensive rotation into pharma; up 14.66% over one year against a broadly flat Nifty |
| 4 | Eternal | 320.00 | +1.30% | Over 1.05 crore shares traded; quick-commerce demand insulated from crude |
| 5 | Wipro | 179.55 | +0.84% | Second IT counter in the top five; the sector was the only major green index |
| 6 | Kotak Mahindra Bank | 390.25 | +0.67% | Only large private bank to close higher; buying after the FCNR(B) swap news knock |
| 7 | Tata Consumer Products | 1,068.00 | +0.60% | Staples bid as investors sought earnings visibility over cyclicality |
| 8 | Infosys | 1,119.80 | +0.43% | Held gains despite a 1.38% Nasdaq fall overnight, a notable divergence |
| 9 | TCS | 2,289.00 | +0.39% | Largest IT weight participating in the bounce, confirming sector breadth |
| 10 | Titan Company | 5,068.00 | +0.38% | Jewellery pricing power intact with gold jewellery inflation running near 33% |
Top 10 Losers on 19 August 2026
The losers list is a near-perfect inversion: energy, utilities, rate-sensitive lenders and hospital chains. Notice how many are regulated or capital-intensive businesses, the exact profile that suffers when bond yields rise.
| # | Stock | Close (₹) | Change | Why it moved |
|---|---|---|---|---|
| 1 | Max Healthcare | 997.00 | -1.72% | Biggest Nifty laggard; high-multiple healthcare de-rates fastest when yields rise |
| 2 | Coal India | 400.00 | -1.70% | Dragged with the energy complex; index shed 1.2% on the session |
| 3 | Power Grid | 263.50 | -1.68% | Classic bond proxy; rising global yields make its regulated return less attractive |
| 4 | Bajaj Finance | 1,080.20 | -1.29% | Cost-of-funds sensitivity; NBFCs reprice quickly on yield moves |
| 5 | ITC | 267.05 | -1.09% | Featured among Q1 FY27 earnings disappointments; heavyweight drag on the index |
| 6 | Jio Financial Services | 243.15 | -1.08% | Financials weakness plus growth-stock multiple compression |
| 7 | Reliance Industries | 1,311.00 | -0.83% | Highest-weight Sensex loser; explains part of the Sensex-Nifty divergence |
| 8 | Tata Steel | 184.00 | -0.81% | Profit-taking after the metals run; diverged from JSW Steel on the day |
| 9 | IndiGo | 5,180.00 | -0.77% | Fuel is roughly a third of airline costs; Brent near $92 is a direct hit |
| 10 | Dr Reddy’s Laboratories | 1,170.00 | -0.75% | Named among Q1 FY27 laggards; diverged from Sun Pharma’s gain |
Two pairs in these tables reward a closer look. JSW Steel gained 1.44% while Tata Steel fell 0.81%. Sun Pharma rose 1.33% while Dr Reddy’s fell 0.75%. In both cases the divergence traces back to Q1 FY27 earnings quality rather than to sector sentiment. That is what a market looks like when it has stopped trading themes and started trading results.
Sector Performance: IT, Banking, Pharma, Metals and Consumer Goods Compared
Sector leadership in 2026 has rotated harder than the flat-looking benchmark suggests. Over the twelve months to early August, the Nifty was roughly unchanged while the Nifty Auto index rose about 25.75% and Nifty Pharma about 23.77%. An index-level investor earned nothing; a sector-aware one earned a great deal.
| Sector | 19 Aug move | Recent trend | Q1 FY27 earnings signal | Positioning stance |
|---|---|---|---|---|
| Information technology | +0.7% | Fell 4% over prior three sessions before bouncing | Mixed; margin support from a 95.68 rupee | Accumulate on weakness; watch Nasdaq correlation |
| Banking and financials | -0.4% | Nifty Bank down only 0.04%; strongest relative index | SBI standalone profit up 10.23% to ₹21,121 crore | Core overweight; cleanest balance sheets in a decade |
| Pharmaceuticals | Positive | Roughly 23.77% one-year gain for Nifty Pharma | Uneven: Sun Pharma strong, Dr Reddy’s a laggard | Stock-specific, not sector-wide; defensive ballast |
| Metals and mining | Mixed | Second-largest contributor to Q1 profit recovery | Hindalco up 118%, JSW Steel up 96%, Vedanta up 152% | Cyclical; already rerated, trail stops advisable |
| Energy and oil | -1.2% | Among the two biggest drags of the session | ONGC among the strong FY27 starters on crude | Underweight downstream, selective upstream |
| Consumer goods and FMCG | Mixed | ITC down 1.09%; Tata Consumer up 0.60% | Food inflation at 5.52% squeezes gross margins | Neutral; wait for input costs to peak |
| Automobiles | Soft | Roughly 25.75% one-year gain for Nifty Auto | Car prices in CPI deflation at minus 6.72% | Best twelve-month performer; volume-led, not price-led |
| Defence | -1.5% | Largest single sectoral fall of the session | Order-book driven, not quarter driven | High beta to geopolitical headlines in both directions |
The Q1 FY27 earnings season is the crucial context here, and it was genuinely exceptional. Nifty 50 aggregate profit after tax grew 18% year-on-year, the highest in ten quarters and 800 basis points ahead of the 10% consensus estimate. Aggregate revenue growth of 19.4% was the best in eight quarters. Nineteen sectors beat expectations, and the analyst upgrade-to-downgrade ratio improved to 1.5.
Metals drove the surprise, moving from among the bottom ten contributors a year earlier to the second-largest contributor this quarter. Hindalco’s profit rose 118%, JSW Steel’s 96% and Vedanta’s 152%. On the other side, InterGlobe Aviation, ITC and Dr Reddy’s disappointed. The Nifty gained 6.9%, or 1,534.4 points, during the April-June quarter itself.
Top 10 Stocks to Watch on NSE and BSE for 2026
What follows is not a set of personal tips. It is the large-cap basket that Motilal Oswal Financial Services published for calendar 2026 in its India Valuations Handbook, cross-referenced against the price action and earnings evidence available as of 19 August 2026. The brokerage’s preferred sectors for the year are diversified financials, IT services, automobiles, telecom and capital goods, with energy, metals and utilities held underweight.
| # | Stock | Sector | Price on 19 Aug (₹) | Investment rationale and sector trigger |
|---|---|---|---|---|
| 1 | ICICI Bank | Private banking | 1,402.00 | Core financials holding. Fell 0.71% on the session, offering entry into an index where credit costs are near cycle lows and the banking index is outperforming the benchmark. |
| 2 | State Bank of India | Public banking | Around 1,112 | Standalone Q1 FY27 net profit of ₹21,121.22 crore, up 10.23% year-on-year. The clearest earnings delivery in the PSU banking space and typically the highest dividend yield among the majors. |
| 3 | Bharti Airtel | Telecom | Index heavyweight | Tariff-led revenue per user expansion with a capital expenditure cycle past its peak. Telecom is one of the few sectors where pricing power is rising rather than being squeezed by input costs. |
| 4 | Infosys | IT services | 1,119.80 | Held a 0.43% gain despite a 1.38% Nasdaq decline. A rupee at 95.68 adds direct margin support to dollar revenue, and the sector was upgraded to mildly overweight in the CY26 model portfolio. |
| 5 | Larsen & Toubro | Capital goods | Index heavyweight | Direct beneficiary of gross fixed capital formation growing 8.2% in FY26 with a 10.8% Q4 print, a thirteen-quarter high. Recent ONGC offshore pipeline and wellhead platform contract wins add order-book visibility. |
| 6 | Mahindra & Mahindra | Automobiles | Index heavyweight | Autos returned roughly 25.75% over twelve months. Rural demand is corroborated by rural unemployment falling to 4.5% and rural labour participation rising to 58.0%. |
| 7 | Titan Company | Consumer discretionary | 5,068.00 | Closed 0.38% higher on a red day. Jewellery inflation near 33% is a headwind for volumes but demonstrates the pricing power that a branded retailer can pass through. |
| 8 | Bharat Electronics | Defence electronics | Nifty constituent | The defence index fell 1.5% on the session, which is the point. Order-book businesses in this space are driven by multi-year procurement cycles rather than by a single week of geopolitical headlines. |
| 9 | Tech Mahindra | IT services | Nifty IT constituent | The recovery play within IT services, with margin expansion supported by rupee depreciation and cost optimisation alongside deal ramp-ups. |
| 10 | Max Healthcare | Healthcare | 997.00 | The session’s largest Nifty loser at 1.72% down. High-multiple healthcare de-rates fastest when yields rise, which is what creates the entry point for investors with a multi-year horizon. |
On valuation: what to check before you buy any of these
Stock-level P/E, PEG and dividend yield change every single trading day, and a figure quoted in an article is stale before you read it. What is worth anchoring to is the index picture, because that is what determines whether the whole market is cheap or dear. As of 19 August 2026 the Nifty 50 traded at a trailing P/E of 20.36 against a ten-year median near 23.4, a price-to-book of 2.93 and a dividend yield of 1.18%. Motilal Oswal pegs the 12-month forward P/E at 21.2 times against a long-period average of 20.8 times. Translation: the index is fairly valued, not cheap and not expensive. For individual names, pull the live P/E and yield from the NSE or BSE quote page and compare it against that stock’s own five-year range, not against the index.
Stock Recommendations for Today: Eight Points to Trade and Invest By
These are frameworks rather than calls. Nobody who publishes an article at 8:30 AM knows where the close will be.
- Respect 24,000 on the Nifty as the line that matters. A close below it on strong volume changes the short-term structure and argues for patience. A defence of it, especially with the GIFT Nifty pointing up, sets up the base for a relief rally toward the 24,400 zone.
- Use the low VIX to buy protection, not to sell it. At 11.32, index put options are historically inexpensive. If you hold a large equity book and cannot stomach a crude spike, hedging has rarely cost less. Selling volatility here offers minimal premium for meaningful tail risk.
- Buy banks on weakness, not on strength. The Nifty Bank’s 0.04% decline against the benchmark’s 0.32% is textbook relative strength. Any pullback driven by liquidity headlines rather than credit-quality news is an accumulation opportunity in the large private lenders.
- Treat the IT bounce as tactical until the Nasdaq confirms. The 0.7% gain came after a 4% three-session slide. With the Nasdaq down 1.38% overnight, a genuine sector reversal needs two or three sessions of the Nifty IT index holding gains while US tech is soft.
- Avoid adding to airlines and downstream oil while Brent holds above $90. IndiGo’s 0.77% decline is arithmetic, not sentiment. Fuel is roughly a third of an airline’s cost base and there is no hedge that survives a sustained supply-driven crude rally.
- Rate-sensitive bond proxies need a yield peak first. Power Grid down 1.68% and Bajaj Finance down 1.29% are the same trade expressed twice. Both become attractive when global long yields stop rising, and not before.
- Let earnings quality, not sector labels, break ties. JSW Steel up 1.44% against Tata Steel down 0.81%, and Sun Pharma up 1.33% against Dr Reddy’s down 0.75%, are the market rewarding delivered Q1 numbers. Screen for companies that beat, not for sectors that are in favour.
- Stagger purchases across the next three to four weeks. The August CPI print lands on 14 September and the next MPC decision runs from 5 to 7 October. Both are known volatility events. Deploying in tranches around them beats a single lump-sum entry.
A Diversified Portfolio for Three Risk Appetites
The correct allocation is not a function of market level. It is a function of when you need the money and how much decline you can watch without acting. Here are three constructions using the sectors and evidence discussed above.
Worked example: what a ₹10 lakh balanced portfolio looks like
Allocate ₹3.5 lakh to financials, ₹2 lakh to IT services, ₹1.5 lakh to automobiles, ₹1 lakh to capital goods, ₹1 lakh to pharmaceuticals and ₹1 lakh to metals. At the Nifty’s dividend yield of 1.18%, the aggregate income component is roughly ₹11,800 a year before tax, which is not the point of this portfolio but is worth knowing. If the market repeats the current seven-session move of 2.1%, the paper loss is about ₹21,000. If you cannot look at a ₹21,000 decline without wanting to sell, you are in the wrong risk band and should move to construction one.
What to Watch Next: The Calendar That Will Set the Tone
Frequently Asked Questions
Why has the Nifty fallen for seven consecutive sessions in August 2026?
The cause is external rather than domestic. Brent crude climbed to around $92 a barrel on renewed West Asia tensions, the rupee weakened to 95.68 against the dollar, and long-term bond yields in the United States, Germany and Japan rose sharply, with the 30-year US Treasury yield touching its highest level since 2007. Higher risk-free yields abroad make emerging-market equities relatively less attractive. Indian fundamentals moved in the opposite direction over the same period.
What are the Sensex and Nifty levels today, 20 August 2026?
The Sensex closed at 76,909.68 on 19 August, down 0.42%, and the Nifty 50 at 24,078.30, down 0.32%. Nifty Bank finished at 57,239.75, effectively flat at minus 0.04%. As of 6:53 AM IST on 20 August, GIFT Nifty was trading at 24,219.00, up 0.08% from its previous close, pointing to a flat-to-mildly-positive open. Check live levels on NSE or BSE before acting.
What is the current RBI repo rate and when is the next policy meeting?
The repo rate is 5.25%, held unanimously by all six Monetary Policy Committee members at the 62nd meeting from 3 to 5 August 2026. The standing deposit facility is 5.00% and the marginal standing facility and Bank Rate are 5.50%, with a neutral stance retained. The RBI raised its FY27 GDP forecast to 6.7% and cut its inflation forecast to 5.0%. The next MPC meeting is scheduled for 5 to 7 October 2026.
Is India’s CPI inflation of 4.45% a problem for the stock market?
It is a 19-month high and the highest since December 2024, but the composition is reassuring. Housing inflation was 2.22% and urban headline inflation 3.96%, which are not signs of demand-driven overheating. The pressure sits in food at 5.52%, fuel-linked services and precious metals. It stays within the RBI’s 4% target band with 2 percentage points of tolerance. Economists expect roughly 4.7% in August and above 5% in September.
Are foreign investors selling Indian stocks right now?
Not on a net basis this month. Foreign portfolio investors bought Indian equities worth ₹11,347.65 crore in August through 18 August, including net purchases of ₹1,651.50 crore on 18 August itself. There have been individual selling days, notably ₹2,535.10 crore on 17 August, but domestic institutions absorbed those comfortably, buying ₹5,101.50 crore the same day. Domestic flows have been positive on nine of the last ten reported sessions.
Which sectors performed best in India during 2026 so far?
Over the twelve months to early August, Nifty Auto gained roughly 25.75% and Nifty Pharma roughly 23.77%, while the Nifty 50 itself was close to flat. In the most recent session, information technology was the only major sectoral index to close higher, gaining 0.7%, while defence fell about 1.5% and energy 1.2%. On earnings, metals were the standout, moving from among the weakest contributors a year ago to the second-largest contributor to Q1 FY27 profit growth.
How strong were Q1 FY27 corporate earnings in India?
Unusually strong. Nifty 50 aggregate profit after tax grew 18% year-on-year, the highest in ten quarters and 800 basis points above the 10% consensus estimate. Revenue growth of 19.4% was the best in eight quarters, 19 sectors beat expectations, and the analyst upgrade-to-downgrade ratio improved to 1.5. Hindalco’s profit rose 118%, JSW Steel’s 96% and Vedanta’s 152%, while IndiGo, ITC and Dr Reddy’s disappointed.
Is the Indian stock market expensive at current levels?
By its own history it is fairly valued rather than expensive. The Nifty 50 traded at a trailing P/E of 20.36 on 19 August 2026, about 12.6% below its ten-year median near 23.4, with a price-to-book of 2.93 and a dividend yield of 1.18%. On forward earnings, Motilal Oswal places the 12-month forward P/E at 21.2 times against a long-period average of 20.8 times. Neither reading suggests a bubble or a bargain.
What does India’s unemployment data say about consumer demand?
It is the most encouraging data point in the current set. Unemployment fell to 5.1% in July 2026 from 5.5% in June, with rural unemployment dropping to 4.5% from 5.0%. Crucially, the labour force participation rate rose to 55.4% from 54.4% and female participation climbed from 32.7% to 34.4%, meaning the economy absorbed more entrants and still reduced joblessness. That combination usually precedes durable consumption demand.
Should I buy stocks now or wait for the correction to end?
This is a personal decision that depends on your horizon and tolerance, and nobody can time a bottom reliably. What the data supports is staggering purchases rather than making one lump-sum entry, because two known volatility events lie ahead: the August CPI print on 14 September and the RBI policy decision from 5 to 7 October. A seven-session decline of 2.1% is shallow, and the India VIX at 11.32 suggests an orderly move rather than distress. Consult a SEBI-registered investment adviser for guidance specific to your circumstances.
Final Thought: The Gap Between the Data and the Tape
Strip everything above down to its essentials and one tension defines this market. The Nifty has fallen for seven consecutive sessions and closed at 24,078.30, its longest losing run in nearly a year. Over roughly the same window, India reported its strongest full-year GDP growth in the current series at 7.7%, corporate India delivered its best profit quarter in ten with Nifty 50 earnings up 18%, unemployment fell to 5.1% with labour participation rising to 55.4%, and the central bank was relaxed enough to raise its growth forecast and cut its inflation forecast in the same statement.
Markets are not irrational when they behave this way. They are pricing a variable the domestic data does not capture: the cost of imported energy and the cost of global capital. Brent near $92 and a 30-year US yield at 2007 levels are real, quantifiable headwinds, and neither is within India’s control.
The unique insight worth carrying out of this briefing is the divergence between the two investor classes. Foreign investors bought ₹11,347.65 crore of Indian equity in August through the 18th, during a falling market, while the loudest narrative insisted they were leaving. Domestic institutions bought on nine of the ten most recent reported sessions, absorbing every foreign selling day without the index breaking. A decade ago, ₹2,535 crore of foreign selling in a single session would have gapped the market down. On 17 August 2026 it barely registered, because domestic funds put ₹5,101 crore back in the same day.
Combine that with an India VIX of 11.32, a trailing Nifty P/E of 20.36 against a ten-year median near 23.4, and a banking index that barely moved while the benchmark fell, and this looks far more like a market waiting for an oil headline than a market discounting a deterioration in India. The macro is doing its job. The earnings are doing theirs. The tape is waiting on a variable priced in Vienna and traded in New York.
Watch 24,000 on the Nifty, watch Brent below $85, and watch the FII cumulative number. If the first two hold and the third stays positive, the seven-session slide will read as noise in a quarter’s time. If crude runs and foreign flows turn, the September inflation print near 5% becomes the story instead. Both paths are open this morning, and the honest position is to size your portfolio so that either one is survivable.