India’s Biggest Stock Market Crashes: What History Reveals About Market Risk
Markets · Index history · India, 1991 to 2026
How Deep Was Every Indian Stock Market Crash Since 1992, and Where Does 2026 Rank?
Nine major drawdowns, one benchmark, and the arithmetic of getting back to level. Figures as reported on 28 August 2026.
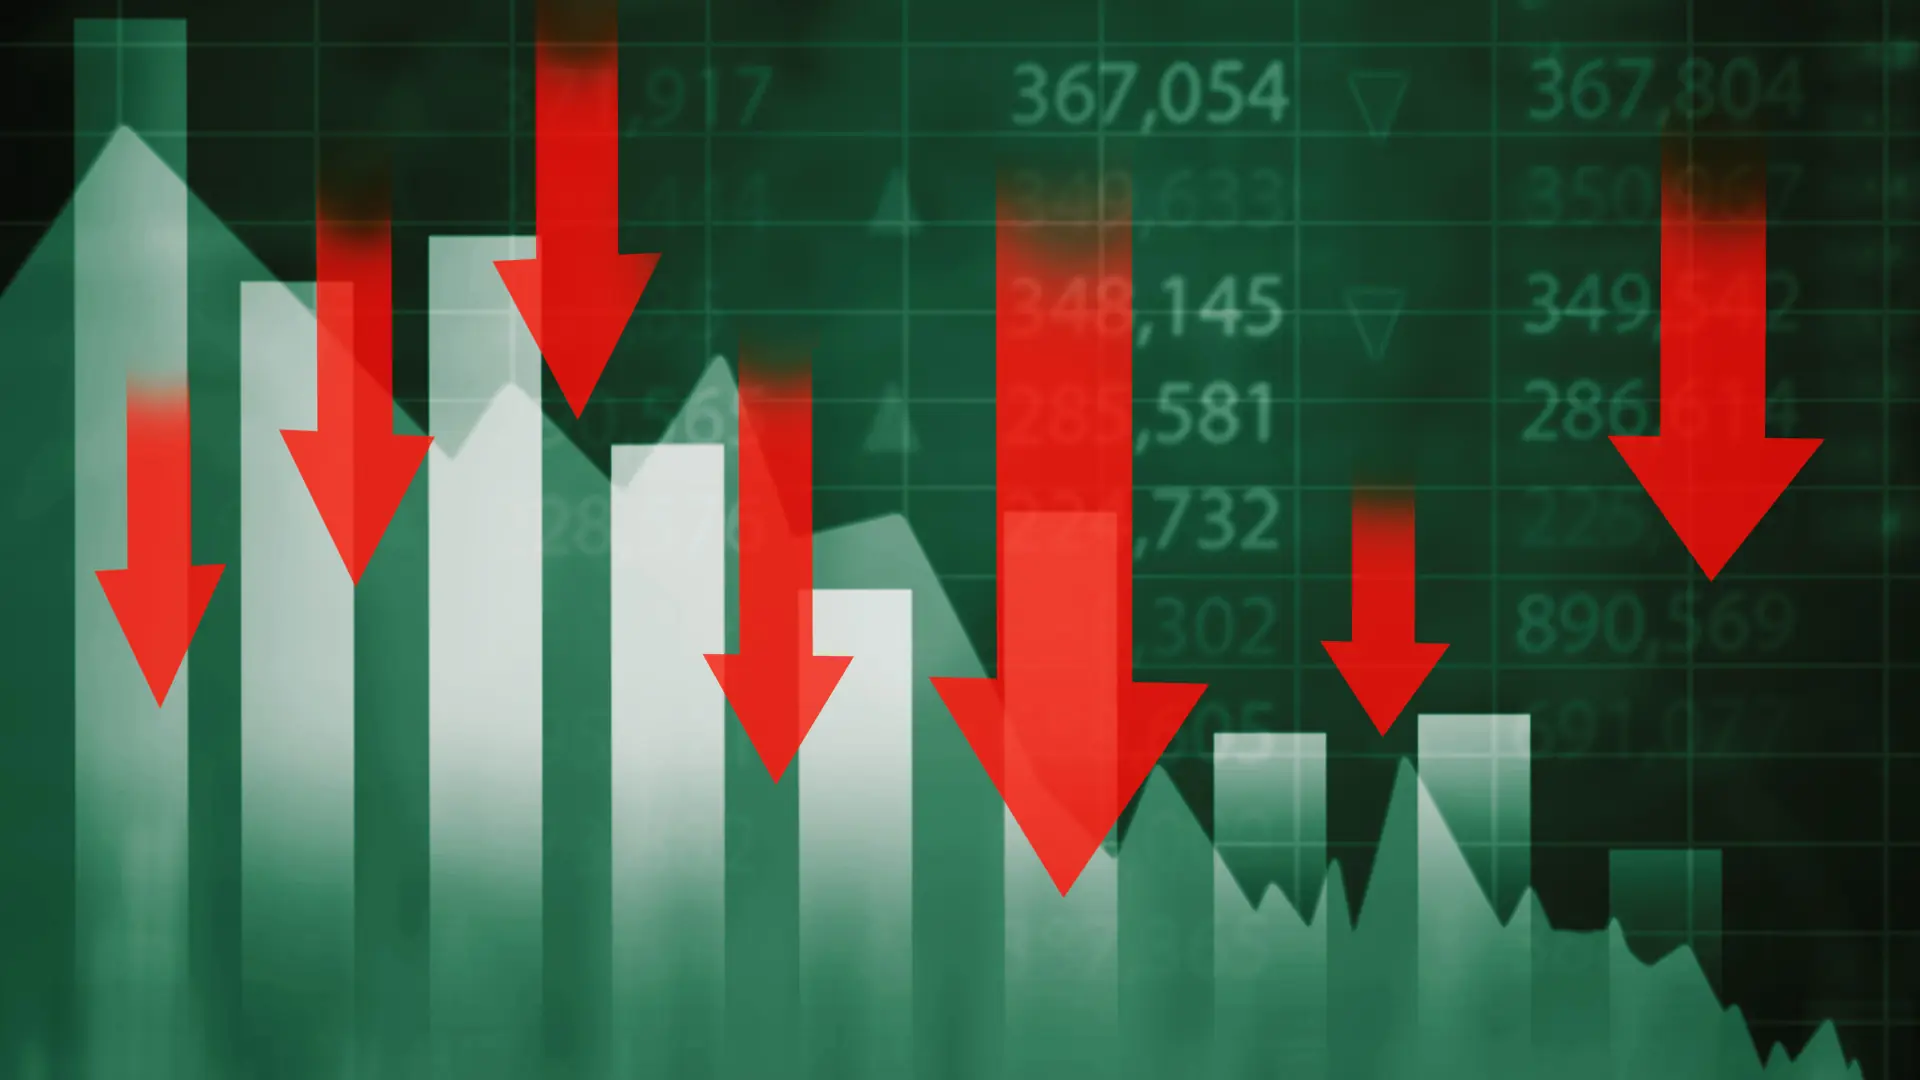
Nine red circles on one line, spread across thirty-five years. That is the shape of India’s equity market history when you plot only the disasters: 1992, 2000, 2001, 2004, 2008, 2015, 2020, 2022 and now 2026. Each one felt terminal while it was happening. Each one is a bump on a line that finished far higher than where it started.
The most recent circle is the one people are actually searching for. The Middle East selloff that began at the end of February 2026 knocked the benchmark down by 15.43% in the dataset behind this chart, and by late August the index is still meaningfully below its high. That is a real loss. It is also, measured against the record, the second smallest fall on the list.
Quick Summary
Across nine major crashes since 1992, India’s benchmark has fallen anywhere from 14.49% to 64.55% peak to trough. The 2008 global financial crisis remains the deepest by a wide margin. The 2026 Middle East selloff at 15.43% ranks eighth of nine. The average fall across all nine events is roughly 35.6%, and the median is 38.55%, which means most Indian crashes have been closer to a bear market than to a panic.
Nine crashes, thirty-five years: the full scoreboard on one screen
The dataset covers the period from 1991 to 2026 and marks nine separate episodes. Two were domestic scandals. Three were imported from global markets. Two were driven by war or geopolitics. One was a pandemic. One was a political surprise at home.
Ranking them this way changes the story that the original chart tells. Plotted chronologically, the crashes look like they are getting more frequent. Ranked by depth, they look like they are getting shallower. Both readings are true at once, and the second is the more useful one for anyone deciding what to do with a portfolio today.
What actually counts as a crash, and why 15% and 64% share a chart
There is no regulator-issued definition of a crash. Market convention treats a fall of 10% from a recent high as a correction and 20% or more as a bear market, with the word crash reserved for declines that arrive fast enough to trigger visible panic. The chart under discussion uses a looser rule: it marks episodes that mattered, regardless of whether they cleared the 20% bar.
That matters for reading the 2022 and 2026 entries honestly. At 14.49% and 15.43%, neither is technically a bear market. Both are corrections that felt like crashes because of what caused them. Grouping them with 2008 on the same visual is defensible as narrative history, but it is not a like-for-like severity comparison.
DIP · 0 events
CORRECTION · 2
BEAR MARKET · 5
SEVERE · 1
GENERATIONAL · 1
The 2026 Middle East selloff, from first strike to August rebound
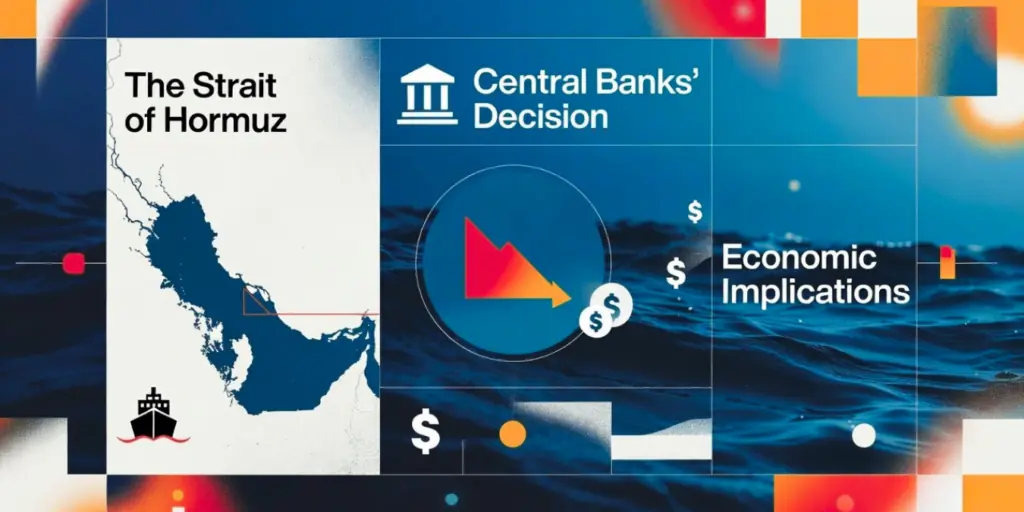
This is the only event on the chart that is still unfolding, which makes it the hardest to place. The sequence is well documented. Coordinated US and Israeli strikes on Tehran on 28 February 2026 opened the conflict. Crude broke above $100 a barrel and kept going, at one point trading above $113 on the Brent contract, which is the single number that matters most for an oil-importing economy.
Two things stand out in that arithmetic. First, the 16.96% high-to-low range on the Sensex is wider than the 15.43% marked on the chart, which is a strong hint that the chart is measuring closing levels or a different benchmark rather than intraday extremes. Second, the recovery is real but partial. Reclaiming a high always demands a bigger percentage than the fall that created the gap.
The money that actually moved
BSE-listed market capitalisation fell from about Rs 4,63,50,671 crore at the end of February 2026 to about Rs 4,15,97,339 crore, a reduction of roughly Rs 47.53 lakh crore in 23 trading sessions, or close to 10.3% of total market value. Over the same stretch, foreign portfolio investors sold heavily while domestic institutions bought: FPI outflows in March 2026 alone were reported at about Rs 86,780 crore, against domestic institutional buying of more than Rs 1.11 lakh crore in the same month.
What we know
These are the points supported directly by the source dataset or by published market reporting, with no interpretation added.
- Nine major crash events are marked on India’s benchmark between 1992 and 2026.
- The deepest is the 2008 global financial crisis at 64.55%, followed by the 1992 Harshad Mehta scam crash at 53.58%.
- The two scam-driven crashes, 1992 and 2001, together removed 53.58% and 38.55% respectively.
- The 2020 COVID-19 crash of 39.40% was the fastest, running from a January peak to a late-March trough.
- The 2026 Middle East selloff is marked at 15.43%, the second smallest of the nine.
- The Sensex traded between 71,545.81 and 86,159.02 over the 52 weeks to 21 August 2026.
- March 2026 was the Sensex’s steepest monthly decline since March 2020, at more than 11%.
What is still unclear
Reading a single infographic as settled fact is how bad decisions start. Four things in this dataset are genuinely unresolved, and an honest article says so rather than papering over them.
- Which index the percentages refer to. The source does not name Sensex or Nifty. Some figures line up better with one, some with the other, and the 1992 event predates the Nifty entirely, since that index was launched in 1996.
- Whether the falls are measured on closing or intraday levels. The difference is not trivial. On the 2026 episode alone it is the gap between 15.43% and 16.96%.
- The exact start and end dates of each drawdown. Only the 2004 entry carries a specific date, 17 May 2004. The rest are labelled by year.
- Whether the 2026 figure is final. The drawdown is still live. If the index falls below its August level, that number will need revising upward.
Why the percentage differs depending on who is counting
A peak-to-trough decline can be measured four defensible ways: highest close to lowest close, intraday high to intraday low, month-end to month-end, or from a named event date. Each produces a different number for the same crash. None is wrong. When comparing two crash statistics from different sources, the first question is always which of those four was used, because a 5 percentage point gap is often just methodology rather than disagreement about history.
The recovery arithmetic nobody prints on the poster
Here is the part that gets left off almost every crash infographic. A fall and its recovery are not symmetrical. A 50% decline needs a 100% gain to get back to level, because the gain is calculated on a smaller base. The deeper the hole, the more brutally that asymmetry works against you.
Worked example: Rs 10 lakh through the two worst crashes
An investor holding Rs 10,00,000 in an index-tracking portfolio at the January 2008 peak would have seen it fall to Rs 3,54,500 at the 64.55% trough. To get back to Rs 10,00,000, that Rs 3,54,500 has to grow by Rs 6,45,500, which is a gain of 182.1%. The same Rs 10 lakh through the 1992 crash falls to Rs 4,64,200 and needs 115.4%. Through the 2026 selloff at 15.43%, it falls to Rs 8,45,700 and needs only 18.2%. That last number is why a correction and a crash should never prompt the same response.
Every crash, side by side, with the numbers that matter
This is the table to save. It pairs each event with what it did to a notional Rs 10 lakh holding and what the climb back looked like in percentage terms.
| Event and year | Peak-to-trough fall | Rs 10 lakh becomes | Gain needed to recover | Trigger category |
|---|---|---|---|---|
| Global financial crisis, 2008 | -64.55% | Rs 3,54,500 | +182.1% | Imported credit shock |
| Harshad Mehta scam, 1992 | -53.58% | Rs 4,64,200 | +115.4% | Domestic fraud |
| Dot-com bubble burst, 2000-01 | -39.57% | Rs 6,04,300 | +65.5% | Valuation unwind |
| COVID-19 crash, 2020 | -39.40% | Rs 6,06,000 | +65.0% | Pandemic and lockdown |
| Ketan Parekh scam, 2001 | -38.55% | Rs 6,14,500 | +62.7% | Domestic fraud |
| Black Monday, 17 May 2004 | -29.77% | Rs 7,02,300 | +42.4% | Political surprise |
| China market crash, 2015 | -25.00% | Rs 7,50,000 | +33.3% | Imported growth scare |
| Middle East selloff, 2026 | -15.43% | Rs 8,45,700 | +18.2% | Geopolitics and crude |
| Russia-Ukraine selloff, 2022 | -14.49% | Rs 8,55,100 | +16.9% | Geopolitics and crude |
The rupee columns are straight arithmetic on the published decline percentages. They assume a portfolio that tracks the index exactly, with no fresh money added and nothing sold. Real portfolios rarely behave that way, which is usually good news: money added during the fall lowers the average cost and shortens the climb.
Decoder: the words that appear in every crash headline
Crash coverage runs on a small vocabulary, and most of it has precise meanings that get blurred in a panic. This table covers the terms readers are most likely to meet during a selloff.
| Term | What it actually means | What it tells you |
|---|---|---|
| Correction | A fall of 10% or more from a recent high | Common. 2022 and 2026 both sit here. |
| Bear market | A fall of 20% or more, usually sustained | Five of the nine events cleared this bar. |
| Crash | A steep, fast decline with panic selling | No fixed threshold. A description, not a metric. |
| Drawdown | The distance from a peak to a subsequent trough | The measure used for every figure on this chart. |
| Circuit breaker, 10% | Market-wide halt when Sensex or Nifty moves 10% | 45-minute halt before 1pm, 15 minutes till 2:30pm, none after. |
| Circuit breaker, 15% | Second-stage market-wide trading halt | Longer halt. Rare. Last widely seen in 2020. |
| Circuit breaker, 20% | Third stage, halts trading for the rest of the day | Has never been triggered in normal Indian trading. |
| India VIX | Expected near-term volatility, in annualised percent | Hit 71.56 in March 2020 and 27.17 in March 2026. |
| FPI or FII outflow | Net selling by foreign portfolio investors | About Rs 86,780 crore of net selling in March 2026. |
| DII inflow | Net buying by domestic mutual funds and insurers | More than Rs 1.11 lakh crore in March 2026. |
| Market capitalisation | Combined value of all listed companies | Fell about Rs 47.53 lakh crore in 23 sessions in 2026. |
| Lower circuit | The floor price a stock or index may not breach that day | Signals one-way selling with no buyers at the price. |
What separates the crashes that scarred from the ones that faded
Sort the nine events by cause rather than by depth and a pattern appears immediately. The two deepest crashes on the list, 2008 and 1992, both damaged the plumbing of the financial system itself. The 1992 episode was a fraud that ran through bank receipts. The 2008 episode was a credit crisis that froze global funding. In both cases the market was not simply repricing risk, it was questioning whether the machinery worked.
Compare that with the geopolitical selloffs. In 2022 and 2026, earnings were intact, banks were solvent and the settlement system never wobbled. What changed was the price of crude and the appetite of foreign investors for emerging-market risk. Those are inputs, not foundations. Markets reprice inputs quickly.
The middle group is the interesting one. The dot-com unwind, the Ketan Parekh crash and the 2020 pandemic fall all landed between 38% and 40%, and they got there by very different routes. Two were valuation problems, one was a genuine economic stop. Depth alone tells you very little about cause.
The uncomfortable observation most crash articles skip
Investors consistently misjudge which falls are dangerous. The events that hurt long-term wealth most were not the loud ones with a single dramatic session. They were the slow ones where the index ground lower for a year and people gave up somewhere near the bottom. The 2008 drawdown took roughly fifteen months from peak to trough. The 2020 drawdown took about two months. The faster crash was less damaging to disciplined investors precisely because there was less time to lose conviction.
The single most useful reframe
Stop asking how far the market has fallen and start asking how far it has fallen relative to the fall that would break your plan. A 15% correction that triggers a panic sale converts a temporary loss into a permanent one. A 40% bear market that you continue investing through does not. The number on the chart is not the risk. Your reaction to it is.
A practical checklist for the next one, because there will be one
Nine crashes in thirty-five years works out to roughly one major event every 3.9 years. That is not a forecast, it is a base rate, and it is the most useful thing on this page for planning purposes.
If you want a sequence rather than a list, this is the order that tends to work when an index is falling and the news is loud.
- Establish which band the fall is in: under 10%, 10% to 20%, or above 20%. That single classification governs everything that follows.
- Identify the cause category: fraud, credit, valuation, pandemic, politics or geopolitics. The first two have historically been the deep ones.
- Check whether your own income is exposed to the same shock. A crude-driven selloff hits an aviation employee differently from a software engineer.
- Confirm your emergency fund covers at least six months before touching any equity decision.
- Decide once, in writing, whether you are pausing, continuing or adding. Then stop checking the index daily.
Frequently asked questions
What was the biggest stock market crash in India’s history?
By peak-to-trough decline, the 2008 global financial crisis is the largest on this dataset at 64.55%. The 1992 Harshad Mehta scam crash is second at 53.58%. Every other event on the record falls below 40%. If you are comparing single-day falls instead, the record belongs to 23 March 2020, when the Sensex dropped 13.15% in one session.
How much has the Indian market fallen in the 2026 Middle East selloff?
The dataset marks the 2026 selloff at 15.43%. Measured on the Sensex 52-week range to 21 August 2026, the high-to-low move was 16.96%, from 86,159.02 down to 71,545.81. The difference is almost certainly a measurement choice between closing and intraday levels rather than a factual disagreement.
Is the 2026 fall a crash or just a correction?
By the standard convention it is a correction, not a bear market, because it has not yet reached a 20% decline from the peak. It is grouped with larger crashes on this chart because of its cause and its impact on sentiment, not because it matches them in depth. The drawdown is also still live, so the final figure may change.
Why does the market need a bigger gain to recover than the size of the fall?
Because the recovery percentage is calculated on the reduced base. If Rs 100 falls 50% to Rs 50, getting back to Rs 100 means adding another Rs 50 to a base of Rs 50, which is a 100% gain. Applied to the record: 64.55% down needs 182.1% up, while 15.43% down needs only 18.2% up.
How often does the Indian stock market crash?
Nine major events over the 35 years from 1991 to 2026 gives an average interval of about 3.9 years. That is a historical base rate rather than a schedule. Crashes cluster around credit cycles, valuation extremes and geopolitical shocks, so the actual gaps have ranged from a single year to seven.
What is a circuit breaker and when does trading stop in India?
Market-wide circuit breakers halt all equity and derivative trading when either the Sensex or the Nifty, whichever is breached first, moves 10%, 15% or 20% in a session. At the 10% level the halt lasts 45 minutes before 1pm and 15 minutes between 1pm and 2:30pm, with no halt after 2:30pm. The system was introduced in July 2001 and modified in September 2013.
Which index do these crash percentages refer to, Sensex or Nifty?
The source does not specify. This is a genuine limitation worth knowing about. The 1992 figure can only refer to the Sensex, since the Nifty was launched in 1996, while some later figures align more closely with Nifty levels. Treat the numbers as a directional record of severity rather than a precise single-index series.
What should an investor actually do when the market is falling sharply?
Classify the fall by band and by cause before acting, confirm that your emergency fund covers at least six months of expenses, and decide once whether you are pausing, continuing or adding rather than revisiting the decision daily. This is general information, not personalised advice, and your own goals and time horizon should drive the call.
The short version
India’s benchmark has been through nine major drawdowns since 1992, ranging from 14.49% to 64.55%. The two deepest were the ones that damaged the financial system itself, in 1992 and 2008. The geopolitical selloffs, including 2022 and the current 2026 episode, have been about a quarter as deep. At 15.43%, 2026 ranks eighth of nine, and the Sensex has already recovered 8.45% from its 52-week low while remaining 9.94% below its high. The chart’s real lesson is not that crashes happen. It is that the depth of a fall determines the size of the climb back, and that the climb is always larger than the fall.