Sensex Today, 4 September 2026: Why Nifty 50 Is Stuck Below 24,000 — and Which Level Decides the Next Move
Markets · Indian Equities · Friday, 4 September 2026
Sensex Today, 4 September 2026: Why Nifty 50 Is Stuck Below 24,000 — and Which Level Decides the Next Move
You opened the app this morning and the arrow was green. Overnight the Dow rose more than a per cent, GIFT Nifty was quoting above 24,000, and the pre-open screen showed the Sensex up over 500 points. Yet the index you actually own closed yesterday at its lowest level since 24 July, and the week is still down 303 points. That gap between the mood and the tape is the whole story of Indian markets right now, and it comes down to two numbers: an oil price near 96 dollars and a Nifty that has not been able to hold 24,000.
Quick Summary
The Nifty 50 closed at 23,873.45 on Thursday, 3 September, down 41 points, while the Sensex shed 417.49 points to 76,152.86, a fourth straight losing session. Friday opens on a firmer footing: GIFT Nifty was at 24,031 and the Sensex pre-open print was 76,657. The bull case rests on a domestic economy growing at 7.8 per cent with the repo rate parked at 5.25 per cent. The bear case is a single commodity: Brent October futures at 96 dollars and a US-Iran conflict with no visible off-ramp. The level that settles the argument is 24,000 on the upside and 23,800 on the downside.
What Does the Indian Market Actually Look Like This Morning?
Start with the confirmed numbers rather than the sentiment. Thursday was the fourth consecutive down session for the Sensex, which fell 417.49 points or 0.55 per cent to 76,152.86, its weakest close since 24 July. The Nifty 50 was far more stubborn, giving up 41 points or 0.17 per cent to end at 23,873.45. That divergence matters: damage concentrated in a handful of heavyweights rather than spread across the market.
Underneath, the market was not weak at all. The Nifty Midcap 100 rose 0.37 per cent and the Nifty Smallcap 100 gained 1.20 per cent on the same day. Nifty Realty led the sectoral table with a rise of more than 2 per cent, and Nifty Media, Nifty Private Bank, Nifty PSU Bank and Nifty Bank all outperformed. What dragged was the defensive and consumption block: IT, auto, FMCG and healthcare all underperformed, with Titan down 2.2 per cent and Trent down 1.9 per cent as the biggest laggards.
The most important context for any market prediction on India this week is the flow reversal. Foreign portfolio investors put Rs 27,186 crore into Indian equities in August, the highest monthly figure since September 2024 and a second straight month of buying after July’s Rs 20,200 crore. That follows outflows of Rs 49,340 crore in June, Rs 32,963 crore in May, Rs 60,847 crore in April and roughly Rs 1.17 trillion in March. Even so, foreign investors are net sellers of about Rs 2.4 trillion in calendar 2026, more than the Rs 1.66 trillion they pulled out across all of 2025.
Domestic institutions absorbed that supply. Foreign ownership has slid to roughly 14.7 per cent, a multi-year low, while domestic institutional ownership has climbed to about 18.9 per cent. This is why the market keeps refusing to break, and why the broader market keeps outperforming, because domestic money buys mid-caps and small-caps in a way foreign money historically does not.
The one-line read on investor sentiment
Sentiment is not bearish, it is hostage. Vinod Nair, head of research at Geojit Investments, described the market’s failed rebound as supportive global cues and renewed FII inflows colliding with geopolitical tension and elevated global yields, with strong domestic growth as the structural positive and stubbornly high crude oil as the overhang. Nothing about the domestic story has broken. The market is simply refusing to pay up for it while a war sets the oil price.
Nifty Today: The Ten Numbers That Define This Session
Strip out the commentary and the Nifty picture reduces to a short list of levels and readings. Every one of these comes from Thursday’s close or Friday’s pre-market, and together they explain why traders are describing this as a range rather than a trend.
- Last close 23,873.45. Down 41 points or 0.17 per cent on 3 September, the fourth consecutive session in the red.
- Week to date, down 303 points. That is a 1.25 per cent fall for the Nifty against 1,112 points or 1.44 per cent for the Sensex, so large-cap damage is running roughly 20 basis points ahead of the broader benchmark.
- Pre-open at 23,910.90. The index printed 37.45 points or 0.16 per cent higher in Friday’s pre-open session, with the Sensex indicated 504 points up at 76,657.
- GIFT Nifty at 24,031. Up 55 points at 8:27 AM and quoting around 24,020 at 7:20 AM, the offshore contract is pricing an open above the psychological barrier the cash index cannot hold.
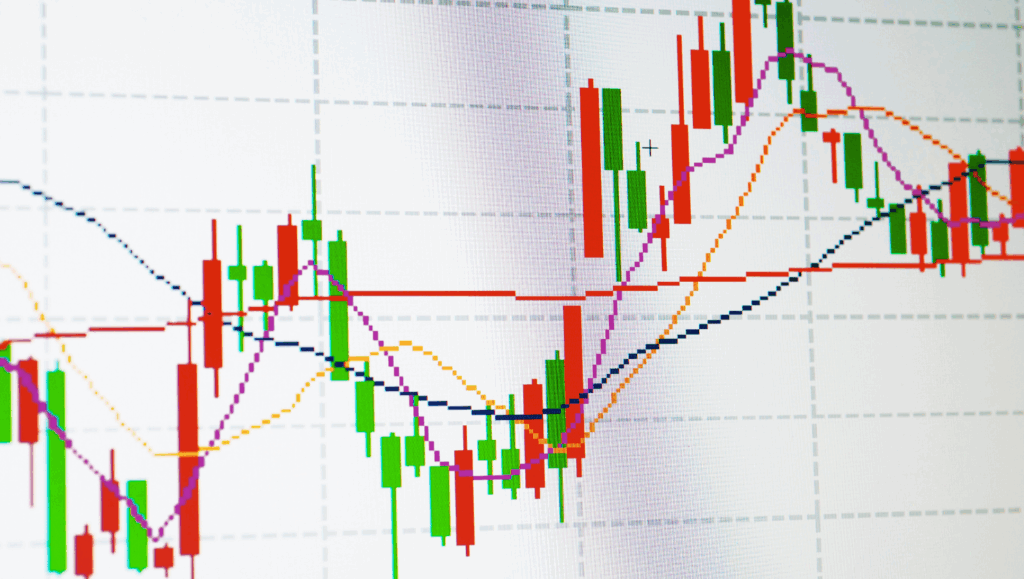
- Resistance is a zone, not a line. Ponmudi R, chief executive of Enrich Money, places immediate resistance at 24,000 to 24,200, and argues a sustained move above 24,200 is needed to stabilise the near-term structure, with 24,400 the level that would signal a meaningful recovery.
- The 10-day EMA sits at 24,081 and is declining. Dhupesh Dhameja of SAMCO Securities notes the index remains below it, which keeps pressure on the short-term structure.
- The 50-day EMA is around 24,150. Pabitro Mukherjee of Bajaj Broking sees a pullback towards that level as plausible because the daily stochastic has reached oversold territory.
- Support at 23,800, then 23,600. Nagaraj Shetti warns that a dip below 23,800 opens 23,600, and Ajit Mishra of Religare Broking called 23,800 an important near-term support with 23,700 to 23,600 as the next shelf.
- RSI at 37.11 against an average of 45.27. Momentum is weak and has not turned. Below 50 and below its own average is a market that bounces without conviction.
- Trailing P/E of 20.18. As of 3 September the Nifty 50 traded at 20.18 times trailing twelve-month consolidated earnings, effectively bang on its long-run average of about 20 to 21.
Trend break
Last defence
Current cage
Supply zone
Structure turns
BSE Sensex vs NSE Nifty 50: How September 2026 Is Actually Unfolding
The most common mistake in reading this market is treating the Sensex and the Nifty as interchangeable. They are diverging, and the divergence is informative. The Sensex is a 30-stock, heavily consumption-and-financials-weighted index; the Nifty spreads the same risk across 50 names. When the Sensex falls three times harder than the Nifty in a single session, as it did on Thursday, the problem is concentrated in a small number of very large companies rather than in Indian equities as an asset class.
| Index | Close, 31 Aug 2026 | August move | Session move, 3 Sept | Close, 3 Sept | What it signals |
|---|---|---|---|---|---|
| BSE Sensex | 76,957.27 | Down 1.46% | Down 417.49 pts, 0.55% | 76,152.86 | Weakest close since 24 July |
| NSE Nifty 50 | 24,080.40 | Down 1.14% | Down 41.00 pts, 0.17% | 23,873.45 | Pinned below the 24,000 mark |
| Nifty Bank | 58,024.95 | Up 1.49% | Up 0.36% | About 57,380 | Leadership, helped by FCNR(B) liquidity |
| Nifty Midcap 100 | 64,224.75 | Up 2.15% | Up 0.37% | Not separately published | Fifth straight monthly gain |
| Nifty Smallcap 100 | 19,931.65 | Up 3.16% | Up 1.20% | Not separately published | Risk appetite is alive below the top 100 |
| Nifty IT | 31,191.45 | Up 1.59% | Underperformed | Not separately published | Tech Mahindra and HCL Tech led the drag |
Two conclusions fall out of that table. August was a month of two markets: benchmarks down, mid-caps and small-caps up for a fifth consecutive month, and NSE-listed market capitalisation still rising by about Rs 5 trillion to roughly Rs 490 trillion. And September has extended the large-cap weakness rather than reversing it, with the Sensex giving up another 1.44 per cent in three sessions.
A worked example: what the index gap costs you
Take Rs 10 lakh split evenly between a Sensex index fund and a Nifty index fund on 31 August. By the close on 3 September, the Sensex leg is worth about Rs 4,94,780 and the Nifty leg about Rs 4,95,700, because the Sensex fell 1.05 per cent from 76,957.27 to 76,152.86 while the Nifty fell 0.86 per cent from 24,080.40 to 23,873.45. The difference is roughly Rs 920 across three sessions. Small. Now run the same split across August, when the Sensex fell 1.46 per cent and the Nifty 1.14 per cent, and the gap widens. Over a year of these divergences, index choice stops being cosmetic. The broader index has been the less punishing place to sit in 2026.
Is India’s 7.8 Per Cent GDP Growth Real? The Economic Engine Behind the Tape
On 31 August the National Statistical Office reported that India’s economy grew 7.8 per cent in the June quarter of FY27, up from 6.9 per cent a year earlier and ahead of the Reserve Bank’s own 7 per cent estimate for the quarter. Real GDP came in at Rs 81.36 lakh crore, nominal GDP at Rs 88.27 lakh crore with growth of 10.3 per cent, and real gross value added at Rs 73.82 lakh crore, up 8.2 per cent. Manufacturing GVA grew 9.2 per cent, capital goods production rose 15.2 per cent, services expanded about 10 per cent and investment activity grew 11.9 per cent.
Then came the argument. Former finance secretary Subhash Chandra Garg contested the number, arguing growth was closer to 2.6 per cent nominal and near zero in real terms. The Centre issued explanatory FAQs on 3 September, because the Q1 FY2025-26 nominal GDP figure of Rs 86.05 trillion under the old 2011-12 base year has been restated at Rs 80 trillion under the new 2022-23 series after successive revisions and the incorporation of new IIP and PPI series. The government’s position is that the two figures belong to different series and cannot be compared.
For an equity investor the direction matters more than the methodology, and the direction is corroborated by data no base-year revision touches. Gross GST collection in August was Rs 1,99,853 crore, up 14.8 per cent, with import revenue surging 29 per cent to Rs 62,604 crore. The services PMI rose to 54.1 with job growth at a 15-month high. Corporate profits agree: Nifty 50 profit growth in Q1 FY27 was 18 per cent, the highest in ten quarters and 800 basis points ahead of expectations, on revenue growth of 19.4 per cent.
CPI Inflation, Repo Rates and Jobs: The Three Dials the RBI Is Watching
Growth is not the constraint on this market. Prices are. Retail inflation rose to 4.45 per cent in July 2026, a 19-month high, on the new CPI series with 2024 as the base year. Rural inflation ran at 4.84 per cent against urban at 3.96 per cent, and the food index climbed 5.52 per cent. Housing inflation stayed benign at 2.22 per cent. The pressure is narrow but violent: silver jewellery inflation printed at 109.84 per cent year on year and the gold, diamond and platinum jewellery category at 32.98 per cent, while personal care ran at 14.8 per cent.
The path from 2.74 per cent in January to 4.45 per cent in July is a straight line upward, and the war in West Asia is the reason. Restaurant and accommodation inflation jumped from 6.91 per cent in June to 7.7 per cent in July as fuel costs fed into unit prices. Telangana led the states at 6.32 per cent, ahead of Andhra Pradesh at 5.72 per cent. ICRA expects August CPI near 4.7 per cent and September above 5 per cent as the base effect turns unfavourable. That print lands on 14 September.
That inflation path is why the repo rate has not moved. On 5 August the Monetary Policy Committee, chaired by Governor Sanjay Malhotra, unanimously held the policy repo rate at 5.25 per cent for a fourth consecutive review and kept the stance neutral. The standing deposit facility stays at 5.00 per cent and both the marginal standing facility rate and the bank rate at 5.50 per cent. Malhotra described the stance as neither dovish nor hawkish, saying the committee wanted greater clarity on the path and composition of inflation before acting again. He also argued that the rise was driven by food and fuel rather than generalised demand, with core inflation excluding precious metals still benign.
The labour market has quietly improved. The Periodic Labour Force Survey for July 2026 put the unemployment rate for people aged 15 and above at 5.1 per cent, down from 5.5 per cent in June. Rural unemployment fell to 4.5 per cent from 5 per cent while urban held at 6.7 per cent, half a point better than the 7.2 per cent of a year earlier. Labour force participation rose to 55.4 per cent from 54.4 per cent, with female participation jumping from 32.7 to 34.4 per cent, across 3,71,021 people surveyed.
Why the RBI cannot simply cut and rescue the market
The repo rate is already down 125 basis points from 6.50 per cent through this easing cycle, with the last cut delivered on 5 December 2025. The RBI now expects inflation to peak at 5.9 per cent in the December quarter. Cutting into an accelerating price cycle driven by imported energy would risk the rupee, already at 94.45 to the dollar against roughly 85 when the depreciation run began. The next MPC meets from 5 to 7 October, and unless crude retreats a hold is the base case. Some economists now discuss a hike as a December tail risk.
Latest Market News: Nine Headlines Moving Indian Stocks Right Now
Every one of these landed in the past 48 hours and each has a direct, traceable effect on a sector or a stock. This is the news flow an Indian investor actually has to price this Friday morning.
- Iran struck Kuwait after US bombardments. Air defence systems intercepted missiles as sirens sounded across parts of Kuwait, escalating a conflict that has no visible de-escalation path. Immediate impact: Brent October futures at 96.12 dollars and WTI near 92 dollars, which is a direct tax on India’s import bill, the rupee and the margins of every oil-consuming manufacturer.
- Fed Governor Christopher Waller turned dovish. He said he would be comfortable holding US rates at current levels if price pressure does not surprise on the upside. Immediate impact: US Treasury yields retreated, the Dow rose 1.18 per cent, the S&P 500 1.06 per cent and the Nasdaq 1.4 per cent, and Asian markets followed. This is the entire reason GIFT Nifty is quoting above 24,000 this morning.
- US August payroll data lands today. The single largest scheduled risk event of the session. A hot print revives rate-hike fears and pressures emerging-market flows; a soft print extends the relief rally into next week.
- FCNR(B) swap inflows exceeded expectations. Over 60 billion dollars was mobilised in the final ten days of the RBI’s swap scheme, taking the total to about 136 billion dollars. Immediate impact: bank stocks rose on an improved liquidity outlook, lifting Nifty Bank, Private Bank and PSU Bank on Thursday.
- The government issued FAQs defending the GDP series. The clarification covers the 2022-23 base year, double deflation, and the restatement of Q1 FY26 nominal GDP from Rs 86.05 trillion to Rs 80 trillion. Immediate impact: limited for prices, significant for the risk premium foreign allocators attach to Indian data.
- UltraTech Cement entered wires and cables. The Aditya Birla Group is investing Rs 1,800 crore in the segment under the Ultravolt brand, operated through its cement arm. Immediate impact: a new growth vector for a stock already facing flagged cost pressures on near-term cement margins.
- Cipla signed a Keytruda biosimilar deal. US subsidiary InvaGen Pharmaceuticals partnered with Qilu Pharmaceutical for exclusive US licensing and supply of QL2107. Immediate impact: a concrete US pipeline catalyst in a sector that already gained 2.50 per cent in August.
- Tata Chemicals faces a Kenya problem. Kenyan President William Ruto has ordered the ousting of Tata Chemicals and is seeking new investors for century-old soda ash mining rights. Immediate impact: a sovereign-risk overhang on a specific asset rather than a sector-wide event.
- SEBI is reviewing the closing auction session. The CAS went live on 3 August for F&O stocks and produced an indicative-value plunge during the 27 August Sensex expiry. Immediate impact: end-of-day volatility that traders must now build into stop placement.
Which Foreign Indices Set India’s Opening Price?
Indian markets do not open in a vacuum. Roughly the first thirty minutes of every session is an act of translation, in which overnight Wall Street moves, Asian trade and the offshore Nifty contract are converted into a domestic opening print. On a morning like this one, that translation is doing all the work.
| Global market | Latest move | Level or price | Transmission channel into India |
|---|---|---|---|
| Dow Jones Industrial Average | Up 1.18% | Thursday close | Sets global risk appetite and the direction of large-cap flows |
| S&P 500 | Up 1.06% | Thursday close | Benchmark for emerging-market allocation decisions |
| Nasdaq Composite | Up 1.4% | Thursday close | Drives Nifty IT sentiment and client-spend expectations |
| Nikkei 225 | Up 0.68% | Friday morning | First Asian read on overnight US news before India opens |
| Kospi | Up 1.01% | Friday morning | Proxy for Asia technology flows competing with India |
| GIFT Nifty | Up 55 points | 24,031 | The most direct signal, priced continuously offshore |
| Brent crude, Oct futures | Up 0.57% | $96.06 | Import bill, rupee, CPI, OMC margins, paint and tyre costs |
| WTI crude futures | Up 0.77% | $92.00 | Confirms the energy shock is global, not a regional spread |
| US Dow and S&P futures | Up 0.06% and 0.05% | Friday pre-market | Signals whether the overnight rally survives the payroll print |
| MCX gold and silver | Down 0.25% and 0.21% | Friday morning | Rs 1,55,114 per 10g and Rs 2,36,860 per kg after August gains of 9.01% and 8.66% |
The pattern in that table is worth naming. Every equity input this morning is positive and every commodity input is negative. When those two forces meet, Indian benchmarks typically gap up and then fade. Watch the first ninety minutes for whether the 24,000 handle survives contact with sellers.
Sector Performance India 2026: Who Is Winning and Who Is Being Squeezed
The sector map is where the 2026 story stops being abstract. Two forces do almost all the work: an energy shock that lifts input costs for anything that ships, packages or processes, and a liquidity improvement that flows straight to lenders.
| Sector index | Close, 31 Aug 2026 | August move | What drove it | September watch |
|---|---|---|---|---|
| Nifty Metal | 13,193.90 | Up 3.77% | Commodity strength and export demand | Global growth signals, dollar direction |
| Nifty PSU Bank | 8,609.55 | Up 2.90% | Liquidity and deposit repricing | Index tested its 200-day moving average |
| Nifty Pharma | 27,186.45 | Up 2.50% | US pipeline news and defensive rotation | Cipla and Qilu biosimilar licensing |
| Nifty Private Bank | 28,005.75 | Up 1.99% | FCNR(B) inflows easing funding cost | Credit growth and net interest margins |
| Nifty IT | 31,191.45 | Up 1.59% | Nasdaq strength, rupee depreciation tailwind | Tech Mahindra and HCL Tech weakness |
| Nifty Bank | 58,024.95 | Up 1.49% | Best-placed sector of the past quarter | Support at 57,100 to 57,200 |
| Nifty Consumer Durables | 40,430.95 | Up 0.91% | Festive-season restocking hopes | Raw material and freight costs |
| Nifty Realty | 904.15 | Down 0.39% | Rate stability, but affordability strain | Rose over 2% on 3 September |
| Nifty Auto | 28,841.50 | Down 0.50% | Tata Motors PV fell 9.09% in the month | Monthly sales data and fuel prices |
| Nifty Financial Services | 26,293.65 | Down 0.97% | Bajaj Finance down 7.38%, SBI Life down 7.52% | NBFC funding costs, insurance flows |
| Nifty Oil & Gas | 11,103.80 | Down 1.19% | Crude at 96 dollars squeezes marketing margins | OMC pricing freedom, subsidy signals |
| Nifty Media | 1,557.35 | Down 3.68% | Advertising softness | Outperformed on 3 September |
| Nifty FMCG | 46,025.55 | Down 6.27% | Palm oil, crude derivative and sugar inflation | HUL, ITC, Dabur, Emami and Godrej Consumer at 52-week lows |
The FMCG collapse is the most instructive move of the quarter. A 6.27 per cent monthly fall in the market’s most defensive sector, with five of its largest constituents at 52-week lows simultaneously, is not a sentiment event. It is a margin event. Palm oil, crude derivatives and sugar inflated together and staples companies cannot pass that through fast enough. ITC alone fell 9.07 per cent over the month.
Banking is the mirror image. The FCNR(B) swap window mobilised about 136 billion dollars in total, easing the funding constraint that has dogged Indian lenders through the deposit-growth slowdown. That is why RBL Bank rallied 5 per cent to a 52-week high on huge volume on Thursday, why IndusInd Bank was the single best Sensex performer at 2.17 per cent, and why the PSU Bank index has been testing its 200-day moving average. If you want one sentence on Indian sector rotation in September 2026: money is leaving the things that consume oil and moving into the things that lend money.
Top 10 NSE and BSE Stocks on 2026 Watchlists
This is not a buy list. It is ten large caps sitting at the intersection of a named brokerage view and a live, dated catalyst, the only defensible basis for a watchlist in a market this news-driven. Nomura’s 2026 India strategy note named ICICI Bank, Axis Bank, Infosys, UltraTech Cement, Mahindra and Mahindra and Bajaj Finance among its top picks while projecting the Nifty at 29,300 by end-2026, a target 22.7 per cent above Thursday’s close.
| Stock | Sector | Dated trigger | Valuation anchor | Risk to watch |
|---|---|---|---|---|
| ICICI Bank | Private bank | Nomura 2026 top pick; private bank index up 1.99% in August | Banking historically trades in a 12 to 20 times band | Deposit competition, microfinance stress |
| Axis Bank | Private bank | Rose 1.32% on 3 September, among the top Sensex gainers | Same 12 to 20 times banking band | Asset quality in unsecured lending |
| HDFC Bank | Private bank | Gained 0.4% on 3 September as FCNR(B) inflows lifted the sector | Index heavyweight, moves with Nifty Bank at 58,024.95 | Margin compression if rates fall |
| Infosys | IT services | Nomura top pick; Nifty IT up 1.59% in August, Nasdaq up 1.4% overnight | IT historically commands 25 to 35 times | US client budgets, discretionary spend |
| UltraTech Cement | Cement | Rs 1,800 crore entry into wires and cables under Ultravolt | Cyclical multiple, swings with the capex cycle | Cost pressures flagged on near-term cement margins |
| Mahindra & Mahindra | Auto | Nomura top pick, though it fell over 1% on 3 September | Nifty Auto at 28,841.50, down 0.50% in August | Fuel costs, rural demand, commodity inflation |
| Bajaj Finance | NBFC | Nomura top pick after a 7.38% August drawdown | Premium NBFC multiple, contracted through 2026 | Funding cost, credit cost normalisation |
| Cipla | Pharma | InvaGen and Qilu deal for QL2107 Keytruda biosimilar in the US | Nifty Pharma at 27,186.45, up 2.50% in August | US regulatory timelines, pricing pressure |
| Tata Power | Power and transmission | Commissioned the 400 kV Jalpura-Khurja corridor in Uttar Pradesh | Regulated-return utility, rate-sensitive | Capex funding, tariff cycles |
| Bharat Electronics | Defence | Rose 6.86% in August; defence order flow visible across the sector | Order-book multiple, high expectations embedded | Execution and lumpy order timing |
Before you use any of this: check the live numbers yourself
Trailing P/E, PEG and dividend yield change every single trading day and any figure printed in an article is stale by the next session. The Nifty 50 itself traded at 20.18 times trailing consolidated earnings on 3 September, against a price-to-book of 3.17 and a dividend yield of 1.20 per cent recorded in mid-June, and a long-run average P/E band of roughly 20 to 21. Pull each company’s current multiple and payout from the NSE or BSE quote page before you act, not from a blog. This is the single most common mistake retail investors make with lists like the one above.
Top 10 Gainers and Losers: Who Actually Moved
Two tables, two time windows. The first five rows in each cover the last completed session on 3 September; the second five cover the full month of August, because a one-day move tells you about news flow while a one-month move tells you about a trend. Both are labelled so you can tell them apart at a glance.
Top 10 gainers
| Stock | Move | Window | Segment | What was behind it |
|---|---|---|---|---|
| Raymond | Up 14% | 3 Sept session | Textiles | Huge volume; up 137% from its 52-week low |
| SML Mahindra | Up 8% | 3 Sept session | Commercial vehicles | Strong August sales, targeting 12% share by FY31 |
| Clean Max Enviro Energy | Up 7% | 3 Sept session | Renewables | Block deal action |
| RBL Bank | Up 5% | 3 Sept session | Private bank | 52-week high on heavy volume, liquidity optimism |
| IndusInd Bank | Up 2.17% | 3 Sept session | Private bank | Best Sensex performer of the day |
| Grasim Industries | Up 8.71% | August month | Diversified | Top Nifty gainer for the month |
| Eternal | Up 8.48% | August month | Internet | Second-best monthly performer in the pack |
| Kotak Mahindra Bank | Up 7.46% | August month | Private bank | Part of the broad banking re-rating |
| Bharat Electronics | Up 6.86% | August month | Defence | Sustained defence order momentum |
| Shriram Finance | Up 6.04% | August month | NBFC | Outperformed a weak financial services index |
Top 10 losers
| Stock | Move | Window | Segment | What was behind it |
|---|---|---|---|---|
| Titan | Down 2.2% | 3 Sept session | Consumer discretionary | Biggest Sensex laggard; gold and silver inflation |
| Trent | Down 1.9% | 3 Sept session | Retail | Second-largest drag, part of the consumption unwind |
| Tech Mahindra | Down 1.65% | 3 Sept session | IT services | Led IT underperformance despite a firm Nasdaq |
| HCL Technologies | Down 1.37% | 3 Sept session | IT services | Sector-wide profit taking |
| Bajaj Auto | Among top losers | 3 Sept session | Auto | Named a top Nifty50 loser alongside Tech Mahindra and Trent |
| Tata Motors Passenger Vehicles | Down 9.09% | August month | Auto | Worst monthly performer in the large-cap pack |
| ITC | Down 9.07% | August month | FMCG | Input-cost inflation; fell a further 1.20% on 3 September |
| Bharti Airtel | Down 8.12% | August month | Telecom | Heavyweight de-rating that hit the Sensex directly |
| SBI Life Insurance | Down 7.52% | August month | Insurance | Dragged the financial services index into the red |
| Bajaj Finance | Down 7.38% | August month | NBFC | Funding-cost concerns despite broker support |
Read the two tables together and one pattern emerges. Nine of the ten gainers are financials, industrials, defence or broader-market names. Eight of the ten losers sit in consumption, autos, telecom or IT. This is a market rotating out of anything with a household as its end customer and into anything with a balance sheet or an order book.
How Should You Build a Portfolio Into This Tape?
A market flat at the index level and rotating violently underneath punishes two opposite mistakes equally. All cash means missing an 18 per cent earnings quarter. All of last year’s winners means owning FMCG through a 6.27 per cent monthly drawdown. The answer is a structure, not a forecast. What follows is an indicative framework, not personal advice, with ranges rather than points because the right number depends on your horizon.
| Risk profile | Large-cap core | Mid and small cap | Debt and cash | Gold and silver | Rebalance trigger |
|---|---|---|---|---|---|
| Conservative, 55 plus or near a goal | 35 to 40% | 0 to 5% | 45 to 55% | 5 to 10% | Any leg drifts 5 points from target |
| Balanced, 10-year horizon | 45 to 50% | 10 to 15% | 25 to 30% | 5 to 10% | Annual, or Nifty moves 10% |
| Growth, 15-year horizon | 50 to 55% | 20 to 25% | 15 to 20% | 5% | Annual, or on a 15% index drawdown |
| Aggressive, high income stability | 45 to 50% | 30 to 35% | 10 to 15% | 0 to 5% | Quarterly review of small-cap weight |
| First-time SIP investor | 70 to 80% | 0 to 10% | 10 to 20% | 0 to 5% | No rebalancing for 24 months |
Three observations make that table usable rather than decorative. Short-duration debt is unusually attractive with the repo at 5.25 per cent and inflation expected to peak at 5.9 per cent in the December quarter. The gold sleeve has already done its job, with MCX gold up 9.01 per cent in August to Rs 1,55,114 per 10 grams and silver up 8.66 per cent, which is when a disciplined investor trims rather than adds. And the mid and small-cap sleeve has delivered five consecutive monthly gains against falling benchmarks, a divergence that historically closes rather than persists.
Stock Recommendations for Today: What the Desks Are Actually Tracking
These are dated observations trading desks published for this session, each with its level or number attached. They are research views held by named firms, not endorsements, and no substitute for your own work or a conversation with a registered adviser.
- Trade the range until 24,200 breaks. Ponmudi R of Enrich Money is explicit that a sustained move above 24,200 is required to stabilise the near-term structure. Below that, rallies are supply, not trend.
- Watch 23,800 as the line that matters. Multiple desks converge here. Ajit Mishra of Religare Broking recommends a cautious, stock-specific approach with strong risk management given elevated crude, geopolitical uncertainty and weak momentum.
- Oil marketing companies are the day’s most direct crude play. BPCL, HPCL and Indian Oil are in focus with Brent at 96.06 dollars. Elevated crude is historically negative for marketing margins unless retail pricing adjusts.
- UltraTech Cement carries a two-sided catalyst. The Rs 1,800 crore Ultravolt wires and cables entry is a growth story landing in the same week analysts flagged cost pressures on near-term cement margins.
- Cipla has a pipeline event, not a price event. The InvaGen and Qilu partnership for QL2107 is a US licensing and supply arrangement; the market prices execution timelines, not announcements.
- Power Grid and Tata Power both have concrete news. Power Grid received a Rs 1,152.49 crore letter of intent for a Gujarat inter-state transmission system; Tata Power commissioned the 400 kV Jalpura-Khurja corridor in Uttar Pradesh.
- Sterlite Technologies announced a Rs 3,000 crore capex plan. Capacity expansion is a multi-year commitment, and the market usually asks about funding before it rewards ambition.
- Bharat Forge is a defence localisation story. Kalyani Strategic Systems signed an MoU with FN Herstal for local manufacturing, extending a theme that lifted Bharat Electronics 6.86 per cent in August.
- Tata Chemicals carries a live sovereign risk. The Kenyan president has ordered its ousting from century-old soda ash mining rights, which is an asset-specific overhang rather than a sector call.
- PSU banks are at a technical decision point. The Nifty PSU Bank index has been testing its 200-day moving average, a level that typically separates a pullback from a trend change.
- Two listings and one IPO reprice the primary market today. ESDS Software Solution and Priority Jewels debut on the exchanges, while Qualiance International opens for subscription seeking Rs 45.11 crore.
- Do not fight the payroll print. The US August jobs report lands after Indian hours. Positioning into it, rather than reacting to it, is where most retail damage happens on days like this.
What people get wrong on mornings like this one
A green pre-open is not a green session. On Thursday the Sensex was down just 16.15 points at 76,554.20 in the closing auction session and still printed a final close of 76,152.86, a swing of over 400 points in the last minutes of trade. SEBI’s closing auction session went live for F&O stocks on 3 August and is now under review, with the NSE revising its pre-open framework from 7 September. Until that settles, anyone placing market orders near the close is taking a volatility bet they may not know they are taking.
Frequently Asked Questions
Why is the Nifty 50 stuck below 24,000?
Because two forces are cancelling each other out. Domestically, GDP grew 7.8 per cent in Q1 FY27, Nifty 50 profits rose 18 per cent, and FPIs bought Rs 27,186 crore of equities in August. Globally, Brent is at 96 dollars on the US-Iran conflict, which lifts India’s import bill, pressures the rupee at 94.45 and pushes CPI towards an expected 5.9 per cent peak in the December quarter. Until crude retreats or the conflict de-escalates, 24,000 to 24,200 remains a supply zone.
What are the key Nifty support and resistance levels for today?
Immediate resistance is 24,000 to 24,200, with the 10-day EMA at 24,081 and the 50-day EMA around 24,150. A decisive move above 24,400 would signal a meaningful recovery. On the downside, 23,800 is the level desks are watching, and a break there opens 23,600. For Bank Nifty, resistance sits at 57,900 to 58,000 and support at 57,100 to 57,200.
What is the RBI repo rate right now and when is the next MPC meeting?
The repo rate is 5.25 per cent, held unchanged on 5 August 2026 for a fourth consecutive review with a neutral stance. The standing deposit facility is at 5.00 per cent and the marginal standing facility rate and bank rate are at 5.50 per cent. The next Monetary Policy Committee meeting runs from 5 to 7 October 2026. The last cut was delivered on 5 December 2025.
Why did the Sensex fall on 3 September 2026?
It fell 417.49 points or 0.55 per cent to 76,152.86 as traders assessed a spike in oil prices and moves in bond yields. Titan lost 2.2 per cent and Trent 1.9 per cent, with ITC, M&M, Bajaj Finserv, HCL Tech, Tech Mahindra and Sun Pharma each falling more than 1 per cent. It was the fourth straight losing session and the lowest close since 24 July, even as mid-caps and small-caps rose.
Is India’s 7.8 per cent GDP growth figure credible?
The number is official, released by the NSO on 31 August 2026 under a new 2022-23 base-year series that also introduced double deflation in agriculture and manufacturing. It has been publicly contested, and the Centre issued explanatory FAQs on 3 September. The independent corroboration is strong: August GST collection of Rs 1,99,853 crore was up 14.8 per cent, services PMI hit 54.1, and Nifty 50 Q1 profits grew 18 per cent. Treat the headline with care and the direction with respect.
What is India’s current CPI inflation rate and where is it heading?
Retail inflation was 4.45 per cent in July 2026, a 19-month high, with food inflation at 5.52 per cent and rural inflation at 4.84 per cent against urban at 3.96 per cent. ICRA expects roughly 4.7 per cent in August and above 5 per cent in September. The RBI projects 5.0 per cent for FY27 overall, peaking at 5.9 per cent in the October to December quarter. The August print is released on 14 September 2026.
Are foreign investors buying or selling Indian stocks in 2026?
Both, in that order. FPIs sold heavily through the first half of the year, including about Rs 1.17 trillion in March, Rs 60,847 crore in April, Rs 32,963 crore in May and Rs 49,340 crore in June. They then bought Rs 20,200 crore in July and Rs 27,186 crore in August, the best month since September 2024. Net for calendar 2026 they remain sellers of roughly Rs 2.4 trillion, with foreign ownership near 14.7 per cent against domestic institutional ownership of about 18.9 per cent.
Which sectors are leading and lagging in India in 2026?
In August the leaders were Metal at 3.77 per cent, PSU Bank at 2.90 per cent, Pharma at 2.50 per cent, Private Bank at 1.99 per cent and IT at 1.59 per cent. The laggards were FMCG at 6.27 per cent lower with five majors at 52-week lows, Media 3.68 per cent lower, Oil and Gas 1.19 per cent lower and Financial Services 0.97 per cent lower. The rotation is out of consumption and into lenders, metals and defence.
Is the Indian stock market expensive at a Nifty P/E of 20?
Not on its own history. The Nifty 50 traded at 20.18 times trailing consolidated earnings on 3 September, against a long-run average of roughly 20 to 21. Price-to-book was 3.17 and dividend yield 1.20 per cent as recorded in mid-June. That is a fairly-valued market, not a bubble and not a bargain. The bigger valuation question is sectoral, since banking has historically traded in a 12 to 20 times band while IT and FMCG command 25 to 35 times.
What should a first-time investor do in a market like this?
Start with a systematic investment plan into a broad index rather than a stock list, keep six months of expenses entirely outside equities, and do not rebalance for the first 24 months. A sideways benchmark with a strong economy underneath is historically a good accumulation window and a terrible trading window. If you want individual stocks, verify the current P/E, PEG and dividend yield on the NSE or BSE quote page yourself, and consider speaking to a SEBI-registered investment adviser before committing capital.
Final Thought: The Market Is Waiting for One Price to Fall
Set the noise aside and Friday, 4 September 2026 reduces to a simple proposition. India has an economy growing at 7.8 per cent, corporate profits rising 18 per cent at the index level, a policy rate anchored at 5.25 per cent, unemployment down to 5.1 per cent, GST collection running near Rs 2 lakh crore a month, and foreign investors buying for a second consecutive month. That is the profile of a market that should be making highs. Instead the Nifty closed at 23,873.45, the Sensex at 76,152.86, and both are below where they started the month.
The reason is a single price. Brent at 96 dollars, driven by a US-Iran conflict that this week saw Iran strike Kuwait, is what stands between this market and the 29,300 Nifty that Nomura projected for end-2026. Crude sets the import bill, the import bill sets the rupee at 94.45, the rupee sets imported inflation, inflation keeps the RBI on hold at 5.25 per cent with a 5.9 per cent peak still ahead, and the RBI on hold keeps a fairly-valued market at 20.18 times from re-rating. Every link in that chain runs back to the oil price.
The three unique data points worth carrying out of this briefing are these. First, foreign ownership of Indian equities has fallen to about 14.7 per cent while domestic institutional ownership has climbed to roughly 18.9 per cent, which is why every selling wave in 2026 has been absorbed rather than amplified. Second, the mid-cap and small-cap indices have now risen for five consecutive months while the benchmarks fell, a divergence that resolves rather than persists. Third, FMCG fell 6.27 per cent in a single month with five of its largest names at 52-week lows, which is what an energy shock looks like when it finally reaches the grocery aisle.
So the level to watch is 24,000 on the Nifty and 23,800 underneath it, and the number to watch is not on any Indian exchange at all. It is the Brent October contract. If that number starts with an eight instead of a nine, most of what is holding this market down goes away quickly. Until it does, this is a stock-picker’s tape inside a range, and patience is a position.