Indian Stock Market Trends 2025: Key Insights, Top Stocks & Sector Performance for November 10, 2025
Markets · India Equities · Monday, 7 September 2026
Nifty’s Longest Losing Streak in Five Months — and the Level That Decides This Week
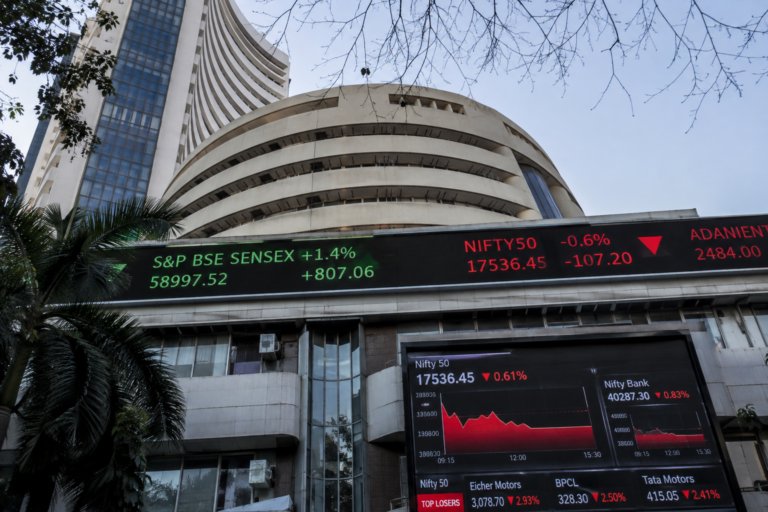
Four weekly candles in a row have closed red. The Nifty 50 sits at 23,897.70, roughly 100 points under the psychological 24,000 line it touched and lost twice last week. Yet the Nifty Smallcap 100 printed a fresh all-time high on the same Friday. That contradiction is the whole story of Indian equities right now, and it is not a glitch in the data.
Two forces are pulling the tape in opposite directions. Crude near $97 a barrel and a suddenly hawkish US rate picture are punishing large-cap index heavyweights and foreign-owned positions. A 7.8% GDP print, a record domestic mutual fund bid and falling unemployment are lifting everything the foreigners do not own. The level where those two forces meet is 23,787, and Monday is the session that tests it.
Quick Summary
The Nifty closed Friday at 23,897.70, up 24.25 points but down 1.15% for the week, its fourth straight weekly decline and the longest such run in five months. The Sensex ended at 76,515.43, up 362.57 points or 0.48%. GIFT Nifty at 23,978 points to a soft Monday open with US markets shut for Labor Day. The decisive downside level is 23,787; the decisive upside level is 24,025, where the 100-day moving average sits. Domestic institutions bought ₹8,930 crore on Friday against ₹3,112 crore of foreign selling, which is why the index is drifting rather than breaking.
Where the Indian Market Stands This Monday Morning
Friday was a session of failed recovery rather than genuine strength. The Nifty opened at 23,910.90, pushed to 24,005.75 in the first half, then bled the entire move away and closed at 23,897.70, barely off the day’s low of 23,895.85. A gain of 24.25 points on the scoreboard hides a candle that ended in the wrong place.
The Sensex read better because of its composition. Its 0.48% rise to 76,515.43 came from Tata Steel, Reliance Industries, Bajaj Finance and Trent, all of which carry more weight in a 30-stock basket than in a 50-stock one. Nineteen Sensex constituents advanced against ten declines. On the Nifty, the split was the other way: 22 up, 28 down.
Bank Nifty is the index to watch for anyone who wants an early warning. It closed at 57,369.65, down 10.95 points, after opening at 57,492.65 and touching 57,677.15. Its RSI sits near 50, which is textbook neutral, and its 52-week range runs from 49,910.85 to 61,764.85. The banking index is neither leading the market down nor pulling it up, and that stalemate is unusual at the end of a four-week decline.
Underneath the benchmarks, the breadth data refuses to cooperate with the bearish narrative. On the NSE, 2,017 stocks advanced against 1,520 declines. The Nifty Smallcap 100 closed at a record high. When the index falls and the market rises, the problem is concentrated in a small number of very large, very foreign-owned stocks.
Nifty Today, Point by Point: What Friday’s Candle Is Really Saying
Technical readings are worth more when they are specific. Here is the Nifty’s current position stated as a set of discrete, checkable facts rather than a mood.
- The index formed an inside candle. Friday’s entire range sat within Thursday’s range, which signals indecision rather than reversal. Inside candles resolve in the direction of the break, so the level that gives way first matters more than the pattern itself.
- The daily candle has a long upper shadow. The Nifty reached 24,005.75 and surrendered the move, closing 108 points below the high. That is profit-booking at resistance, not accumulation.
- The weekly candle made a lower high and a lower low. Compared with the previous week, the structure stepped down on both ends. That is the technical definition of a short-term downtrend still intact.
- RSI is stuck near 40. Momentum is weak but not oversold. Bounces from RSI 40 usually need a catalyst; they rarely happen on their own.
- The index is below its short, medium and long-term moving averages. The 100-DMA sits at 24,025 to 24,028, and the 20 and 50-DMA cluster near 24,204 to 24,205. Every one of them is now overhead resistance rather than support.
- A 424-point consolidation range has broken down. Measured targets from that breakdown land in the 23,600 to 23,528 zone, which coincides with the July low.
- 23,787 is the line that matters. It marks the 2 September low and a parallel low zone. A decisive close below it opens the measured target; holding it keeps the range-bound reading alive.
- Immediate intraday supports are 23,758 and 23,672. Resistances are 24,037 and 24,124. Both sit inside a band barely 450 points wide, which is why intraday reversals have been so violent.
- The weekly loss was 1.15%, with the index closing lower in four of five sessions. Four consecutive down weeks is the longest stretch since April 2026.
- GIFT Nifty at 23,978 is down 71 points ahead of the open, and Wall Street is shut for Labor Day, meaning Monday will trade on domestic flows and crude alone.
Trend break
Danger zone
Current range
Recovery
Trend repair
Sensex vs Nifty 50 in September 2026: Which Benchmark Is Holding Up Better?
Investors treat the two benchmarks as interchangeable. In September 2026 they are not. The Sensex has 30 constituents concentrated in financials, energy and IT; the Nifty spreads across 50 names and a dozen sectors. When the rally is narrow, the narrower index wins, and that is exactly what Friday showed.
| Metric | BSE Sensex | NSE Nifty 50 | Nifty Bank | Nifty Financial Services |
|---|---|---|---|---|
| Close, 4 Sep 2026 | 76,515.43 | 23,897.70 | 57,369.65 | 26,051.00 |
| Day change | +362.57 (+0.48%) | +24.25 (+0.10%) | -10.95 (-0.02%) | +127.95 (+0.49%) |
| Session high | Not disclosed | 24,005.75 | 57,677.15 | Not disclosed |
| Session low | Not disclosed | 23,895.85 | 57,324.55 | Not disclosed |
| Support 1 / 2 | 76,079 / 75,808 | 23,758 / 23,672 | 57,086 / 56,911 | 25,857 / 25,736 |
| Resistance 1 / 2 | 76,952 / 77,223 | 24,037 / 24,124 | 57,653 / 57,829 | 26,245 / 26,366 |
| Advance / decline | 19 up, 10 down, 1 flat | 22 up, 28 down | 5 up, 9 down | 12 up, 8 down |
| Momentum reading | Positive breadth | RSI near 40 | RSI near 50 | Positive breadth |
Read the advance-decline row again. The Sensex closed with nearly two advancers for every decliner while the Nifty closed with more losers than winners on the same day. A 0.38 percentage point gap between two indices tracking the same economy is entirely a composition effect, and it tells you where the money went: into heavyweight metals, energy and private banks, out of telecom, IT and autos.
Worked example: what the divergence costs a portfolio
Take ₹10 lakh split evenly between a Sensex index fund and a Nifty index fund on 3 September and held through Friday’s close. The Sensex sleeve gained 0.48%, or ₹2,400. The Nifty sleeve gained 0.10%, or ₹500. Total gain: ₹2,900 on ₹10 lakh, or 0.29%. Now run the same money through a smallcap index fund, which closed at an all-time high the same day. The point is not that one is better. It is that in September 2026, index choice is contributing more to returns than market direction is.
The Economy Behind the Tape: 7.8% Growth Meets a 4.4% Inflation Problem
India’s macro data is currently better than its market. On 31 August, MoSPI reported real GDP growth of 7.8% for the April to June quarter of FY27, up from 6.9% a year earlier and comfortably above the RBI’s own 7% projection for the quarter. Real GDP rose to ₹81.36 lakh crore from ₹75.46 lakh crore.
The composition was the encouraging part. Manufacturing grew 9.2% and services 10%, while gross value added rose 8.2% and nominal GDP 10.3%. Agriculture eased to 3.6% and mining contracted 2.4% off a high base. The gap between nominal and real growth narrowed to roughly 2.5 percentage points, a sign that the price pressure baked into the deflator has moderated even as activity accelerated.
Inflation is where the comfort ends. Headline CPI rose to 4.4% in June 2026, crossing the RBI’s 4% target midpoint for the first time after sixteen consecutive months below it, and the July print came in around 4.45%. The first quarter averaged 3.9%, thirty basis points below the RBI’s June projection, so the trend deteriorated inside the quarter rather than across it.
At its 3 to 5 August meeting, the Monetary Policy Committee under Governor Sanjay Malhotra voted unanimously to hold the repo rate at 5.25%, keeping the standing deposit facility at 5.00% and the marginal standing facility and Bank Rate at 5.50%. The stance stayed neutral. The RBI simultaneously raised its FY27 growth forecast to 6.7% and trimmed its FY27 CPI forecast to 5.0% with core at 4.3%.
The number nobody is pricing: 5.9%
Buried in the August policy is the RBI’s projection that headline retail inflation will run at 5.9% during October to December 2026. That is inside the 2% to 6% tolerance band but only just, and it sits 190 basis points above the target midpoint. If crude holds near $97 and that projection is met, the market’s assumption that the next repo move is a cut becomes very hard to defend. The next MPC meeting runs from 5 to 7 October 2026.
| Indicator | Latest reading | Prior | Period | Market implication |
|---|---|---|---|---|
| Real GDP growth | 7.8% | 6.9% | Q1 FY27 | Supports cyclicals, capex, banks |
| CPI inflation | 4.45% | 4.4% | July 2026 | Caps rate-cut hopes |
| Repo rate | 5.25% | 5.25% | 5 Aug 2026 | Neutral, data-dependent |
| Unemployment (15+) | 5.1% | 5.5% | July 2026 PLFS | Consumption tailwind |
| Rural unemployment | 4.5% | 5.0% | July 2026 | Rural demand recovery |
| Urban unemployment | 6.7% | 6.7% | July 2026 | Flat, watch services hiring |
| Labour force participation | 55.4% | Lower in June | July 2026 | Female LFPR up to 34.4% |
| Industrial output (IIP) | 6.7% | Not stated | July 2026 | Manufacturing momentum intact |
| Forex reserves | $729.3 bn | Up $12.4 bn weekly | Record high | Rupee defence firepower |
The labour market data deserves more attention than it received. MoSPI’s July Periodic Labour Force Survey showed unemployment among those aged 15 and above falling to 5.1% from 5.5%, with the worker-population ratio rising to 52.5% and female labour force participation climbing 1.7 percentage points to 34.4% in a single month. Rural unemployment fell to 4.5% while urban stayed at 6.7%. That is a rural consumption story forming underneath a large-cap correction.
Latest Market News: Nine Headlines and What Each One Actually Did
Every market note lists news. Fewer connect each item to the rupees it moved. Here is the week’s news flow with the transmission mechanism spelled out.
- US payrolls came in surprisingly strong on Friday. Wall Street fell, with the S&P 500 down 0.4%, the Dow down 0.5% and the Nasdaq down 0.3%. Two-year Treasury yields climbed as much as eight basis points and swap contracts moved to price better than even odds of a Federal Reserve rate hike this month. Higher US yields shrink the return gap that pulls foreign capital into Indian equities.
- Brent crude is near $97 a barrel. It settled at $95.08 after the Indian close on Friday with WTI at $90.76, then firmed again into Monday on renewed US-Iran tension. India imports the overwhelming majority of its crude, so every sustained $10 move feeds the import bill, the current account and the CPI print the RBI is watching.
- Foreign investors sold ₹3,111.90 crore of cash equities on 4 September. Domestic institutions absorbed it with ₹8,930.10 crore of buying, a ratio of nearly three to one. FIIs also held a net short index futures position of 2,35,838 contracts, which is a directional bet, not a hedge.
- The Nifty Smallcap 100 hit a fresh all-time high. Smallcaps are structurally domestic-flow-driven and largely outside foreign ownership, which is precisely why they can print records while the benchmark falls for four weeks.
- Cable and wire stocks cracked. KEI Industries, RR Kabel and Polycab all declined sharply, dragging a segment that had been a retail favourite. Sector-specific de-rating in a crowded trade is how mid-cap corrections usually begin.
- Gland Pharma drew block-deal interest. Reports suggested Fosun Pharma may sell up to a 5% stake worth about ₹22.8 billion. Large promoter or parent sell-downs typically cap a stock near term regardless of fundamentals.
- The new closing-auction mechanism distorted options. Sensex put premiums surged 400% to 500% on Thursday when the indicative index briefly showed a 2.5% fall. Traders cut positions and increased hedging into Friday, which explains part of the failed intraday recovery.
- August auto sales split the sector. Maruti Suzuki shares fell after August volumes declined, while Mahindra & Mahindra reported strong growth. Auto is no longer a single trade.
- Sugar stocks fell on policy. The government reduced dealer stock limits, an immediate margin negative for a sector already dependent on administered pricing.
The one signal that has actually predicted the last four weeks
Not the news. The ratio. On 2 September foreign investors were net buyers of ₹1,143 crore and the index still slipped. On 3 September they sold ₹2,345.87 crore against ₹4,977.46 crore of domestic buying. On 4 September the gap widened to ₹3,111.90 crore out against ₹8,930.10 crore in. Domestic institutions have outbought foreign selling by roughly ₹9,300 crore across those three sessions, which is why the Nifty is down 1.15% for the week rather than 4%. Watch the day that DII buying falls below FII selling.
Which Foreign Indices Are Actually Steering Dalal Street?
Indian equities have never traded in isolation, but the transmission channels differ. Some global indices move the Nifty through sentiment at the open. Others move it through the price of money or the price of oil, which matters far more and lasts far longer.
The four foreign markers that genuinely drive Indian equity pricing today are the US two-year Treasury yield, Brent crude, the dollar-rupee rate and the Nikkei as a proxy for regional risk appetite. Wall Street’s index levels matter mostly for the first thirty minutes of the Indian session. The yield curve matters for the whole quarter.
US markets are closed on Monday 7 September for Labor Day. That removes the usual overnight cue and hands the session entirely to crude, the rupee and domestic institutional flow. Thin-cue Mondays tend to exaggerate whatever direction the first hour establishes, so the 23,787 level is likelier to be tested cleanly than muddied.
Top 10 Gainers and Top 10 Losers: The 4 September Scoreboard
Friday’s movers explain the sector rotation better than any commentary. Insurance and metals led. Telecom, IT and autos lagged. Public sector banks were quietly the worst pocket inside the financial complex.
Top 10 gainers
| # | Stock | Change | Sector | What drove it |
|---|---|---|---|---|
| 1 | SBI Life | +3.50% | Insurance | Top Nifty and FinNifty gainer, insurance re-rating |
| 2 | Tata Steel | +2.49% | Metals | Nifty Metal was the day’s best sector, up over 1% |
| 3 | HDFC Life | +2.42% | Insurance | Second life insurer in the top three, sector-wide bid |
| 4 | Reliance Industries | +1.50% | Oil and gas | Crude strength lifts the refining and upstream complex |
| 5 | Trent | +1.33% | Retail | Consumer discretionary outperformed staples |
| 6 | JSW Steel | +1.30% | Metals | Confirms the metals move was sector-wide, not stock-specific |
| 7 | Adani Enterprises | +1.28% | Diversified | Group infrastructure names firmed with Adani Ports |
| 8 | UltraTech Cement | +1.18% | Cement | Capex and construction cycle read-through |
| 9 | Bajaj Finance | +1.10% | NBFC | Rate-hold benefits leveraged lenders |
| 10 | Kotak Mahindra Bank | +0.80% | Private bank | Best Bank Nifty performer on a flat day for the index |
Top 10 losers
| # | Stock | Change | Sector | What dragged it |
|---|---|---|---|---|
| 1 | HCL Technologies | -1.94% | IT services | Steepest Nifty decline, US demand and rate worries |
| 2 | Bharti Airtel | -1.55% | Telecom | Heavyweight drag on both benchmarks |
| 3 | Maruti Suzuki | -1.27% | Auto | August volumes declined year on year |
| 4 | Bajaj Finserv | -1.11% | Financials | Led FinNifty decliners even as the index rose |
| 5 | Max Healthcare | -1.02% | Healthcare | Defensive rotation out of hospitals |
| 6 | Union Bank of India | -0.94% | PSU bank | Biggest Bank Nifty laggard |
| 7 | IDFC First Bank | -0.90% | Private bank | Smaller private banks underperformed larger peers |
| 8 | ICICI Lombard | -0.77% | General insurance | General insurance lagged while life insurance rallied |
| 9 | State Bank of India | -0.71% | PSU bank | Weighed on both Bank Nifty and FinNifty |
| 10 | AU Small Finance Bank | -0.65% | Small finance | Completed a weak day for non-frontline lenders |
Notice what the two tables have in common. Both life insurers rose more than 2.4% while the general insurer fell. Both large steel names rose while both PSU banks fell. That is not random. It is a market rotating toward long-duration domestic savings plays and hard assets, and away from anything whose earnings depend on US enterprise spending or on a rate cut arriving.
Sector Performance in India, 2026: IT vs Banking vs Pharma vs Consumer
Sector leadership has flipped twice in two weeks. Realty led on 3 September and was the worst performer on 4 September. Metals were the standout on Friday. This is what a market without a dominant theme looks like.
| Sector | 4 Sep move | Current driver | Key risk | Desk stance |
|---|---|---|---|---|
| Metals | Best performer, over +1% | Commodity strength, 9.2% manufacturing growth | China demand, global slowdown | Momentum leader |
| Financial services | +0.49% | Life insurance re-rating, 12 of 20 stocks up | NIM compression if rates rise | Selective, favour insurers |
| Media | +0.30% | Low base, ad recovery | Thin liquidity | Trading only |
| Banking | -0.02% (Bank Nifty) | Credit growth, 7.8% GDP | PSU banks lagging private peers | Neutral, RSI at 50 |
| IT services | HCL Tech -1.94%, TCS -0.48% | Rupee at 94.94 aids margins | US rate hike risk, client budgets | Underperformer |
| Auto | Maruti -1.27% | Rural unemployment down to 4.5% | Divergent August volumes | Stock-specific |
| Pharma and healthcare | Max Healthcare -1.02% | Breakout volumes in select names | Block-deal overhangs | Bottom-up only |
| Realty | Biggest laggard | Was the top sector a day earlier | Rate sensitivity | Avoid chasing |
| Consumer and FMCG | Trent +1.33% | Discretionary beating staples | Food inflation at 4.45% CPI | Prefer discretionary |
That valuation reading is the strongest argument the bulls have. A market four weeks into a decline, with GDP growing 7.8% and the benchmark trading below both its five and ten-year median earnings multiple, is not an expensive market. It is a market waiting for a reason.
Ten Large-Cap Names on Institutional Watchlists for FY27
What follows is a watchlist, not a buy list. It combines names carried in published brokerage research for 2026 with stocks that visibly led Friday’s rotation. Every entry states the trigger and the argument against it, because a list without a bear case is marketing.
| Stock | Sector trigger | Valuation lens | The bear case |
|---|---|---|---|
| ICICI Bank | Named in Nomura’s 2026 top picks; credit growth tracks 7.8% GDP | Screen against index P/E of 20.20x | Fell 0.48% Friday; private bank NIMs compress if the RBI hikes |
| Axis Bank | Also a Nomura 2026 pick; rose 0.47% on a flat Bank Nifty day | Bank valuations usually below index multiple | Bank Nifty RSI stuck at 50, no trend to ride |
| Infosys | Nomura pick; rupee near 94.94 is a direct margin tailwind | IT typically trades at a premium to the index | Sector was Friday’s worst; a US rate hike hits client budgets |
| UltraTech Cement | Rose 1.18%; construction reads off 9.2% manufacturing growth | Cement re-rates on volume, not multiple | Energy costs rise with Brent near $97 |
| Mahindra & Mahindra | Strong August sales; rural unemployment fell to 4.5% | Auto multiples expand late in a rural cycle | El Nino risk flagged by the Finance Ministry for late 2026 |
| Bajaj Finance | Rose 1.10%; NBFCs benefit from a repo hold at 5.25% | Premium NBFC multiple demands premium growth | Bajaj Finserv fell 1.11% the same day, group divergence |
| Reliance Industries | Rose 1.50%; energy complex leverage to crude near $97 | Largest index weight, moves with the benchmark | Refining margins can compress if crude spikes further |
| Tata Steel | Best Nifty gainer at +2.49%; metals led the day | Cyclical, judge on price-to-book not P/E | Momentum trades reverse fastest when China data softens |
| SBI Life | Top gainer at +3.50%; life insurance is the current rotation | Valued on embedded value, not earnings | The rally is three days old, not three quarters |
| HDFC Bank | Rose 1.30% on BSE; largest private lender by weight | Anchor holding for most index funds | Leadership transition has been in the news flow |
On dividend yield, the honest answer at index level is that the Nifty 50 currently yields about 1.18%. Historically, readings above 1.5% have coincided with genuinely cheap markets and readings below 1% with expensive ones. At 1.18% the market is neutral to slightly cautious on that measure, and no individual name in the table above should be bought for income alone.
What the sell side is actually forecasting
Nomura has projected the Nifty 50 reaching 29,300 on a twelve-month view, arguing that India’s relative underperformance normalised valuation premiums while domestic flows anchored stability. Its stated preferences are financials, consumer discretionary, real estate, internet, cement, telecom and manufacturing, with caution on consumer staples, infrastructure, capital goods and healthcare services. The firm’s own warning is worth repeating: narrative-driven stocks with stretched valuations may deliver nothing at all.
A Diversified Portfolio for Three Risk Appetites
Allocation matters more than selection in a market this indecisive. The table below crosses risk appetite against asset sleeve, using the actual instruments available to an Indian retail investor in September 2026.
| Sleeve | Conservative | Balanced | Aggressive | Why |
|---|---|---|---|---|
| Large-cap equity | 35% | 40% | 35% | Index at 20.20x, below both medians |
| Mid and small-cap | 5% | 15% | 30% | Smallcap 100 at a record; momentum, also risk |
| Debt and fixed income | 40% | 25% | 10% | Repo held at 5.25%, yields have eased |
| Gold | 10% | 10% | 10% | 24K closed at ₹1,54,884 per 10g on 4 Sep |
| Cash and liquid | 10% | 10% | 15% | Dry powder for a 23,528 test |
| Expected volatility | Low | Moderate | High | Nifty range is only about 450 points wide |
Stock Recommendations for Today: How a Disciplined Desk Would Trade Monday
No responsible desk issues buy calls into a thin-cue Monday with crude at $97 and the benchmark sitting 110 points above a decisive support. What a desk does issue is a process. Here is that process, point by point.
- Do nothing in the first thirty minutes. With US markets shut for Labor Day and GIFT Nifty down 71 points, the open is a guess. Let the 9:15 to 9:45 range establish itself and use its high and low as the day’s reference.
- Treat 23,787 as binary. Above it, the index is range-bound and mean reversion trades work. A decisive close below it and the measured target of 23,600 to 23,528 becomes live. Do not average down through that line.
- Do not buy resistance. The 100-DMA at 24,025 to 24,028 has rejected the index twice in three sessions. Buying into it without a close above it has been the single most expensive mistake of the past week.
- Stay with the leaders while leadership holds. Metals and life insurance produced the top four gainers on Friday. Rotation persists for days, not hours, but it ends without warning, so trail stops rather than adding.
- Avoid the crowded mid-cap trades. The cable and wire complex fell together. When a whole sub-sector de-rates in one session, the second and third days usually hurt more than the first.
- Respect block-deal overhangs. A reported sell-down of up to 5% in Gland Pharma is a supply event. Supply events cap rallies regardless of how good the fundamentals look.
- Use the FII futures position as context. A net short of 2,35,838 index futures contracts means any strong up move triggers covering. Short covering rallies are fast and unreliable, so take profits into strength rather than extrapolating.
- Watch the rupee at 94.94. A sharp depreciation past that level with crude near $97 would pressure importers and lift IT margins simultaneously, which changes sector leadership within a single session.
- Size for volatility, not conviction. The Nifty’s working range is roughly 450 points, about 1.9%. A position sized for a 5% move will be stopped out by noise.
- Mark the calendar, not the chart. The August CPI print lands mid-September and the MPC meets 5 to 7 October. Those two dates carry more directional risk than anything on Monday’s screen.
Habits that separate survivors from spectators in a choppy tape
Frequently Asked Questions
Why has the Nifty 50 fallen for four straight weeks in September 2026?
Three reasons compounded. Brent crude climbed toward $97 a barrel on renewed US-Iran tension, which pressures India’s import bill and inflation outlook. A strong US jobs report pushed swap markets to price better than even odds of a Federal Reserve rate hike this month, lifting global yields. And foreign investors sold ₹3,111.90 crore of cash equities on 4 September alone while holding a net short of 2,35,838 index futures contracts. The Nifty fell 1.15% last week, its fourth consecutive weekly decline.
What is the most important Nifty level to watch this week?
23,787. It marks the 2 September low and a parallel low zone. A decisive close below it activates the measured target of the recent range breakdown, placed at 23,600 to 23,528 near the July low. On the upside, the index must reclaim 24,025 to 24,028, where the 100-day moving average sits, before any recovery can be called confirmed. The 20 and 50-day averages sit higher still, near 24,204 to 24,205.
What is the RBI repo rate right now and when is the next MPC meeting?
The repo rate is 5.25%, held unanimously at the 3 to 5 August 2026 meeting with a neutral stance. The standing deposit facility is 5.00% and the marginal standing facility and Bank Rate are 5.50%. The RBI raised its FY27 growth forecast to 6.7% and cut its FY27 CPI forecast to 5.0%, with core at 4.3%. The next Monetary Policy Committee meeting runs from 5 to 7 October 2026.
How fast is India’s economy actually growing in FY27?
Real GDP grew 7.8% year on year in the April to June quarter of FY27, up from 6.9% a year earlier and above the RBI’s own 7% projection for the quarter. Manufacturing grew 9.2%, services 10%, gross value added 8.2% and nominal GDP 10.3%. Agriculture slowed to 3.6% and mining contracted 2.4%. CareEdge Ratings has raised its full-year FY27 estimate to 7.3% against the RBI’s 6.7%.
Why are smallcaps at a record high while the Nifty 50 keeps falling?
Ownership. The Nifty Smallcap 100 hit a fresh all-time high on 4 September while the benchmark fell for a fourth week because smallcaps are overwhelmingly held by domestic investors, and domestic institutions bought ₹8,930.10 crore that same day. Large caps carry the foreign ownership that is being reduced. Historically this divergence has closed through smallcaps correcting rather than large caps rallying to meet them, so treat the record as a risk signal as much as a strength signal.
Is the Indian stock market expensive at current levels?
Not on headline measures. The Nifty 50 traded at a price-to-earnings ratio of 20.20 as of 4 September 2026, roughly 8% below its five-year median of 22.01 and about 13% below its ten-year median of 23.3. The price-to-book ratio was 2.93 and the dividend yield 1.18%. A yield above 1.5% has historically marked genuinely cheap markets, so the current reading is neutral rather than a signal.
Which foreign indices influence the Indian stock market the most?
The US two-year Treasury yield and Brent crude matter more than any equity index, because they set the cost of capital and India’s import bill. Among equity markets, Wall Street’s overnight close drives the first half hour, while the Nikkei 225, which rose 1.47% to 65,158 on Friday, acts as a proxy for Asian risk appetite. GIFT Nifty, quoted at 23,978 on Monday morning, is the most direct pre-open indicator.
What did FIIs and DIIs do in the first week of September 2026?
Foreign investors were net buyers of ₹1,143 crore on 2 September, then turned sellers of ₹2,345.87 crore on 3 September and ₹3,111.90 crore on 4 September. Domestic institutions bought throughout: ₹1,847 crore, ₹4,977.46 crore and ₹8,930.10 crore across those three sessions. Domestic buying exceeded foreign selling by roughly ₹9,300 crore, which is why the index drifted rather than broke.
Which sectors led and lagged on 4 September 2026?
Nifty Metal was the best performer, gaining over 1%, followed by Nifty Financial Services at 0.49% and Nifty Media at 0.30%. Nifty Realty was the biggest laggard, having led the market a session earlier. Within stocks, SBI Life rose 3.50%, Tata Steel 2.49% and HDFC Life 2.42%, while HCL Technologies fell 1.94%, Bharti Airtel 1.55% and Maruti Suzuki 1.27%.
What are the biggest risks to Indian equities for the rest of 2026?
Four stand out. Crude near $97 feeding into inflation and the current account. The RBI’s own projection of 5.9% headline inflation for October to December, which would make rate cuts very difficult. A possible US Federal Reserve hike that widens the yield gap and keeps foreign money leaving. And the Finance Ministry’s warning that an intensifying El Nino peaking in late 2026 could hurt Rabi sowing and rural demand.
Final Thought: What This Market Is Actually Telling You
The Indian market entering the week of 7 September 2026 is not a weak market. It is a market with a split personality, and the split is between who owns what. The Nifty 50 at 23,897.70 has fallen 1.15% in a week and four weeks in a row because foreign money is leaving large caps. The Nifty Smallcap 100 hit a record on the same Friday because domestic money is arriving everywhere else.
The economy underneath is running faster than either group is positioned for. Growth of 7.8% in Q1 FY27, manufacturing at 9.2%, unemployment down to 5.1%, forex reserves at a record $729.3 billion, and an index trading at 20.20 times earnings against a ten-year median of 23.3. Those are not the inputs of a bear market. They are the inputs of a correction inside an expansion.
What is genuinely different this time is the inflation arithmetic. The RBI expects 5.9% headline inflation in the October to December quarter, which is 190 basis points above its own target midpoint. Crude near $97 makes that projection more likely to be met than missed. Most retail positioning still assumes the next repo move is downward. That assumption is the largest unhedged risk in Indian portfolios right now, and it is not on any chart.
So the week reduces to two numbers. Hold 23,787 and this is a range with a floor. Lose it and 23,600 to 23,528 becomes the conversation. Everything else, the news flow, the block deals, the sector rotation, is detail arranged around that single line.