Why Sensex and Nifty Sank to a Six-Month Low, and What Smart Investors Should Do Before the Bell
Dalal Street Briefing / Thursday, 6 August 2026
Sensex Holds 78,581, Nifty Guards 24,600 and the One RBI Number Nobody Is Talking About
The repo rate did not move. The growth forecast did. Here is the complete August 2026 market briefing on BSE Sensex, NSE Nifty 50, Nifty Bank, inflation, sector rotation and the stocks actually doing the work.
If you only glanced at the headline numbers on Wednesday, you would conclude that nothing happened. The Sensex added 152 points. The Nifty 50 added under ten. A rate decision landed exactly where every economist said it would. But underneath that flat tape, the Reserve Bank of India quietly nudged its growth forecast up and its inflation forecast down in the same breath, metals ripped 1.72 percent while media bled 1.58 percent, and IT heavyweights kept sliding even as the rupee finally stopped falling. That is not a boring market. That is a market in the middle of a rotation.
So why did a policy day that delivered zero surprises still move eleven sectors in different directions?
This briefing answers that. It walks through the BSE Sensex and NSE Nifty 50 close, the Nifty Bank trend that has stalled just under a six-week breakout, India’s GDP growth trajectory, the CPI inflation print that pushed past the 4 percent target for the first time in half a year, and the RBI repo rate decision and what it signals for the October meeting. Then it gets practical: a Sensex versus Nifty comparison table for August 2026, the day’s top ten gainers and losers with reasons attached, sector performance across IT, banking, pharma, metals and consumer goods, a screened list of top NSE and BSE stocks for 2026, and three portfolio templates built for different risk appetites.
Every figure here is anchored to the 5 August 2026 closing session and the pre-open setup for 6 August, drawn from exchange-reported data, the RBI’s August policy statement, MoSPI releases and company filings.
Section 01Indian Market Overview: A Flat Close That Hid a Violent Rotation
Where the benchmarks actually finished
The BSE Sensex closed Wednesday at 78,581.00, up 152.05 points or 0.19 percent. The NSE Nifty 50 settled at 24,624.65, up a token 9.75 points or 0.04 percent. On paper, a nothing session. In practice, the index gave back almost everything it started with: the Sensex opened at 79,055.38, a gap-up of 626 points, and surrendered close to 475 points of that from the opening bell to the closing bell.
That fade matters more than the close. It tells you that the buying enthusiasm ahead of the policy announcement was thinner than it looked, and that sellers were waiting at higher levels. The RBI delivered exactly what the street had priced, and once the certainty arrived, so did the profit-booking.
The broader market told a happier story
Below the frontline, sentiment was measurably better. The Nifty Midcap 100 closed at 63,605.25, up 0.18 percent, and the Nifty Smallcap 100 finished at 19,783.70, up 0.76 percent. Thirteen of twenty-four sectoral indices closed green. When smallcaps outperform largecaps on a policy day, it usually points to domestic money doing the buying while foreign money stays selective, and that is precisely the flow pattern India has lived with all year.
Nifty Bank trend: stuck at the door it just knocked on
The Nifty Bank index closed at 57,739.95, down 0.29 percent, extending a mild pullback after an eventful start to the month. On Monday 3 August, Bank Nifty had produced its first meaningful close above the 57,500 zone in six weeks, powered by an exceptional PSU banking session as Brent crude cracked more than 6 percent on news of United States and Iran peace negotiations. Cheaper crude removes a real source of asset-quality risk from public sector lenders exposed to energy-linked corporate credit.
Since then, the index has drifted. Private banks were among Wednesday’s laggards, while PSU names held better. Kotak, HDFC Bank and other private lenders were sold into the rate-hold announcement, which is a rational reaction: a bank that has already passed through 100-plus basis points of earlier easing sees its net interest margin compress before its loan growth compensates. Wednesday’s tape looked like exactly that trade being expressed.
Bank Nifty’s 57,500 flip from resistance to support remains the single most important technical marker on the banking chart. Hold it, and the 58,000 to 58,250 band that was tagged in early August comes back into play. Lose it, and the index reverts to the 57,000 to 57,200 congestion it spent late July grinding through.
Investor sentiment: cautious, not fearful
The mood on Dalal Street this week is best described as constructive caution. Three things support it: crude oil back near 79 dollars a barrel after the Strait of Hormuz reopening progress, a rupee that has recovered to a four-week high near 95.09 to the dollar, and a central bank that raised its growth number. Three things restrain it: a manufacturing PMI at its weakest since 2021, a services PMI at a four-and-a-half-year low, and foreign portfolio investors who have been net sellers on a scale India has not seen before.
Add the new closing auction session for futures-and-options eligible stocks, introduced this year, which has visibly increased volatility in the final minutes of trade and is making index closes less predictable than they used to be. Several of the sharp late-session reversals in the last two weeks trace directly to that mechanism rather than to fundamental news.
Section 02Key Economic Drivers: GDP Growth, CPI Inflation and the RBI Repo Rate
India GDP growth: the fastest major economy, again
India closed FY 2025-26 with real GDP growth of 7.7 percent, according to MoSPI provisional estimates released in June 2026, with nominal GDP expanding 8.9 percent. The March quarter alone delivered 7.8 percent real growth and 9.1 percent nominal growth, with real gross value added rising 7.9 percent. That capped a year in which the initial official projection had been a far more modest 6.3 to 6.8 percent band.
The composition matters. Growth through FY26 was carried by what the Economic Survey called a double engine of consumption and investment, with private final consumption expenditure rising to 61.5 percent of GDP. Services led, manufacturing followed, and agriculture recovered from a weak base. For equity investors, that mix is friendly: consumption-led growth flows into FMCG, autos, retail and financials rather than sitting in commodity exporters.
The FY27 handoff is where the story gets interesting
On Wednesday, the RBI raised its FY27 real GDP growth projection to 6.7 percent from 6.6 percent. That is a small upgrade in absolute terms but a meaningful signal in context, because it came in the same statement in which the central bank acknowledged elevated geopolitical risk. The Economic Survey for 2025-26 had pencilled FY27 growth at 6.8 to 7.2 percent with potential growth around 7 percent, so the RBI is sitting marginally below the government’s own range.
The honest reading is that India is decelerating from an exceptional year to a merely good one. A step down from 7.7 percent to 6.7 percent is still world-leading, but it removes the earnings tailwind that a surprise acceleration would have provided.
CPI inflation: the number that has changed direction
India’s retail inflation for June 2026 came in at 4.38 percent, up sharply from 3.93 percent in May and the highest reading in six months. Consumer food price inflation accelerated to 5.32 percent from 4.78 percent. Rural inflation ran at 4.74 percent against urban at 3.92 percent.
Two forces did the damage. First, transport inflation swung to 4.31 percent after a marginal deflation the previous month, which is the delayed pass-through of the West Asia energy shock into petrol and diesel prices reaching Indian consumers. Second, food, where ginger surged more than 50 percent and tomatoes rose close to 32 percent on a weak monsoon and thin supply. Month-on-month, the CPI index rose 1.03 percent, the sharpest sequential jump since January 2025.
Headline inflation is now above the RBI’s 4 percent target, though comfortably inside the 2 to 6 percent tolerance band. Governor Sanjay Malhotra addressed this directly, noting that the increase was driven largely by food and fuel with little sign of generalisation in price pressures so far.
The RBI cut its FY27 CPI inflation projection to 5 percent from 5.1 percent even as the latest actual print accelerated to 4.38 percent. A central bank lowering its inflation forecast while current inflation is rising is telling you it believes the spike is transitory and supply-side. That is the quiet dovish tell inside an outwardly neutral policy, and it is the strongest hint available that the October window stays open for a cut if food prices behave.
RBI repo rate status and monetary policy stance
The Monetary Policy Committee met from 3 to 5 August 2026 and held the repo rate at 5.25 percent with a unanimous vote, retaining the neutral stance. The standing deposit facility stays at 5 percent, and the marginal standing facility and Bank Rate both remain at 5.5 percent. The next MPC meeting is scheduled for 5 to 7 October 2026.
Malhotra framed the hold as a search for clarity rather than a signal of direction, describing the committee as neither dovish nor hawkish and saying future decisions will be guided by headline inflation and how the growth-inflation mix evolves. The policy also carried a proposed framework for depository receipts that could open REITs and listed InvITs to a broader base of global investors, which is a structural positive for Indian real assets that received far less attention than it deserved.
Employment: the soft spot in an otherwise strong macro
India’s overall unemployment rate for persons aged 15 and above held at 5.5 percent in June 2026, unchanged from May, with labour force participation stable at 54.4 percent and the worker population ratio at 51.4 percent. Urban unemployment actually improved year-on-year, falling to 6.6 percent from 7.1 percent in June 2025, and female labour force participation rose 0.7 percentage points to 32.7 percent.
The problem sits underneath the headline. Youth unemployment in the 15 to 29 age group hit a record 16.2 percent in June, the highest since the revamped monthly PLFS series began in April 2025 at 13.8 percent. Youth female unemployment jumped to 20.7 percent from 18.9 percent in a single month. Youth labour force participation slipped to 40.3 percent from 42.7 percent. For consumption-facing companies, a weakening young-adult income base is a slow-burning risk to volume growth that will not show up in any quarterly result for several years.
The activity indicators that argue for caution
July’s purchasing managers’ surveys were the week’s genuine negative surprise. The HSBC India Manufacturing PMI fell to 53.5 from 54.2 in June, revised down from a 53.9 flash reading and marking the weakest expansion since August 2021. The Services PMI collapsed to 53.3 from 57.4, the softest in 53 months. The Composite PMI slumped to 54.3 from 57.1, a four-year low.
Everything is still above 50, so this is a slowdown in the rate of growth rather than a contraction. Export orders actually accelerated, supported by demand from Canada, Egypt, Indonesia, Kenya, Nepal, South Africa, Thailand and the UAE. Input cost inflation eased to a five-month low. But domestic demand softened broadly, business optimism fell to a six-month low, and services firms reported stiffer competition, fewer client enquiries and higher cancellations. GST collections offer a counterweight, with June receipts at 1.95 lakh crore rupees, up 13.9 percent year-on-year.
Section 03NIFTY Today in Detail: The Session Broken Down Point by Point
- Close and change. Nifty 50 settled at 24,624.65, up 9.75 points or 0.04 percent, its second consecutive close above the psychologically important 24,600 handle.
- Opening gap. The index opened at 24,669.20, a gap-up of 54.3 points over Tuesday’s 24,614.90 close, tracking GIFT Nifty futures which had signalled a 161-point premium in the pre-open.
- Intraday behaviour. Nifty spent the morning session in positive territory, faded through the afternoon as the policy statement was digested, and closed barely above the flatline. The full-day range was narrow relative to the opening enthusiasm.
- Market breadth. Advances led declines through late-morning trade with roughly 2,206 shares advancing against 1,434 declining on the exchange, meaning breadth stayed positive even as the index itself went nowhere. That is a rotation signature, not a distribution signature.
- Sector leadership. Nifty Metal, Nifty Auto and Nifty Realty were the outperformers. Nifty Media, Nifty FMCG and Nifty Private Bank were the laggards. Thirteen of twenty-four sector gauges closed positive.
- Top contributor. Shriram Finance led the Nifty 50 pack with a 3.23 percent advance, followed by Grasim Industries at 2.74 percent and JSW Steel at 2.31 percent.
- Biggest drag. Tata Consultancy Services fell 1.91 percent, extending a difficult stretch for the IT majors. Apollo Hospitals and HCL Technologies followed it down.
- Institutional flows. Foreign institutional investors were net buyers of 2,446.47 crore rupees in the cash segment on 4 August, while domestic institutional investors turned net sellers of 936.14 crore rupees, an unusual reversal of the year’s dominant pattern.
- Currency and rates. The rupee firmed to a four-week high near 95.09 against the dollar. The Indian 10-year government bond yield sat near 6.785 percent, close to a one-week low ahead of the policy.
- Setup for Thursday. GIFT Nifty was quoted near 24,674 in the pre-open, indicating an opening premium of roughly 40 points. Immediate support sits in the 24,500 to 24,400 zone with pivots at 24,531, 24,489 and 24,420. Resistance is layered at 24,669, 24,711 and the 24,700 to 24,800 band. Thursday is weekly F&O expiry, which historically compresses direction and expands volume.
- The level that matters. A sustained close above 24,800 opens a technical path toward 25,000. A decisive break below 24,500 shifts the short-term bias to sellers. The index remains above its key moving averages with RSI and MACD still tilted constructive.
BSE Sensex vs NSE Nifty 50: August 2026 Trend Comparison
The two benchmarks have diverged more than usual this month, and the reason is composition. The Sensex is a 30-stock, free-float weighted index dominated by a handful of financials, energy and IT megacaps. The Nifty 50 spreads exposure across metals, autos, cement and NBFCs. In a month where metals are leading and IT is lagging, the Nifty structurally does better, which is exactly what August has shown.
| Date | Sensex close | Sensex change | Nifty 50 close | Nifty change | Session driver |
|---|---|---|---|---|---|
| 31 Jul (Fri) | 78,094.64 | +166.49 (+0.21%) | 24,383.60 | +66.45 (+0.27%) | Auto and financials rally on Q1 earnings beats |
| 3 Aug (Mon) | 78,639.03 | +544.39 (+0.70%) | 24,774.30 | +390.70 (+1.60%) | Crude collapses on Iran-US talks; fourth straight gain |
| 4 Aug (Tue) | 78,428.95 | -210.08 (-0.27%) | 24,614.90 | -159.40 (-0.64%) | Winning streak snaps; broad F&O selling pressure |
| 5 Aug (Wed) | 78,581.00 | +152.05 (+0.19%) | 24,624.65 | +9.75 (+0.04%) | RBI holds at 5.25%; metals lead, IT and FMCG drag |
| Parameter | BSE Sensex | NSE Nifty 50 |
|---|---|---|
| Current level (5 Aug close) | 78,581.00 | 24,624.65 |
| Constituents | 30 stocks | 50 stocks |
| Record high | 86,159.02 (Dec 2025) | Set in the same December 2025 window |
| Distance from peak | Approx. 8.8% below | Broadly comparable drawdown |
| One-year change | -2.44% | +0.21% |
| One-month change | +0.38% | +0.80% |
| Sector tilt | Heavier in financials, energy and IT megacaps | Broader cyclical exposure across metals, autos, cement, NBFCs |
| August behaviour | Steadier, narrower swings | Higher beta on rotation days |
| Immediate support | 78,000 then 77,600 | 24,500 then 24,400 |
| Immediate resistance | 79,050 then 79,500 | 24,800 then 25,000 |
The takeaway for anyone tracking both: the Nifty’s one-year performance is flat while the Sensex is down 2.44 percent over the same window. That two-and-a-half-point gap in twelve months is not noise. It is the market telling you that concentrated megacap exposure has been the wrong place to sit through this cycle, and that breadth has been paying better than size.
Section 05Latest Market News: Seven Stories Moving Indian Equities Right Now
1. RBI holds at 5.25 percent, upgrades growth, trims inflation
Immediate impact: Rate-sensitive sectors reacted in opposite directions. Realty and autos rallied on the confirmation that borrowing costs are not rising. Private banks sold off because a prolonged hold compresses margins without delivering the volume kicker a cut would bring. Bond yields eased toward a one-week low near 6.785 percent. The neutral stance keeps October genuinely live.
2. Services PMI crashes to a 53-month low
Immediate impact: The single most bearish datapoint of the week, and it landed on the same morning as the policy. Services are roughly 55 percent of India’s GDP, so a fall from 57.4 to 53.3 in one month is a real deceleration signal. It weighed directly on consumption-facing names and helps explain why Nifty FMCG closed among the laggards despite no company-specific bad news.
3. Strait of Hormuz partial reopening and Iran-US negotiations
Immediate impact: The dominant macro variable for Indian equities this quarter. Brent has retreated to around 79 dollars, with WTI near 74.8. For an economy importing over 85 percent of its crude, every ten-dollar drop is worth billions in the import bill, feeds directly into CPI transport inflation, supports the rupee and lifts OMCs, paints, tyres, aviation and cement. IndiGo has been among the most consistent beneficiaries. Fresh incidents in the Red Sea keep the risk premium from disappearing entirely.
4. Q1 FY27 earnings season delivers a split verdict
Immediate impact: Banks beat. ICICI Bank posted a 15.9 percent rise in standalone net profit to 14,805 crore rupees with net interest income up 12.7 percent to 24,384 crore and net interest margin holding at 4.36 percent, on loan growth of 19.6 percent. Bharti Airtel beat expectations with quarterly earnings of 13.37 rupees per share. Jio Financial Services grew consolidated profit 156 percent to 830 crore. On the other side, ONGC missed at 9.46 rupees per share, and Reliance Industries reported revenue up 25.4 percent to 3.12 lakh crore but net profit down 22.4 percent to 20,946 crore, purely because the year-ago quarter carried a one-off gain of 8,924 crore on the sale of listed investments.
5. The IT sector’s grinding de-rating continues
Immediate impact: TCS is down over 20 percent in twelve months and Infosys down more than 18 percent. TCS reported Q1 FY27 revenue of 72,275 crore rupees, up 13.9 percent year-on-year in rupee terms but only 2.7 percent in dollars and 3.2 percent in constant currency, with an operating margin of 24 percent and a total contract value of 9.5 billion dollars. The rupee-versus-dollar gap tells the whole story: the reported growth is currency, not demand. Now that the rupee has stopped depreciating, that cushion disappears.
6. Foreign selling on a historic scale, absorbed domestically
Immediate impact: FIIs have net sold roughly 2.7 lakh crore rupees of Indian equities in calendar 2026, with monthly outflows of 70,135 crore in April, 55,963 crore in May and 49,029 crore in June before slowing sharply to about 6,056 crore in July. Over the 22 months since the September 2024 peak, foreign investors have pulled close to 58 billion dollars. Domestic institutions have bought more than 4.16 lakh crore this year and a record 166 billion dollars over the same 22-month window. DII ownership of Nifty 500 companies has risen to a record 21 percent for a ninth consecutive quarter while FII ownership has slipped to 17 percent.
7. The new closing auction session is changing how sessions end
Immediate impact: The mechanism introduced for F&O-eligible stocks has measurably increased volatility in the final minutes of trade. Several of the sharp intraday reversals seen in the last fortnight, including Wednesday’s fade from a 626-point Sensex gap-up, are partly mechanical rather than fundamental. Traders sizing positions off closing prints need to account for this.
Section 06Foreign Indices That Influence the Indian Stock Market
No serious market prediction for India can ignore the overnight tape. Roughly 60 percent of the Nifty’s opening gap is explained by what happened in New York the night before and in Tokyo, Hong Kong and Seoul that morning. Here is where the world stood going into Thursday’s session.
| Index | Level | Latest move | Why it matters for Indian markets |
|---|---|---|---|
| Dow Jones (US30) | 54,423 | +263.24 (+0.49%) | Closed at a record high, fifth straight advance. Sets risk appetite for Asia and drives GIFT Nifty premium. |
| S&P 500 | 7,729.76 | -0.17% | The global benchmark for equity risk pricing and for FPI allocation decisions into emerging markets. |
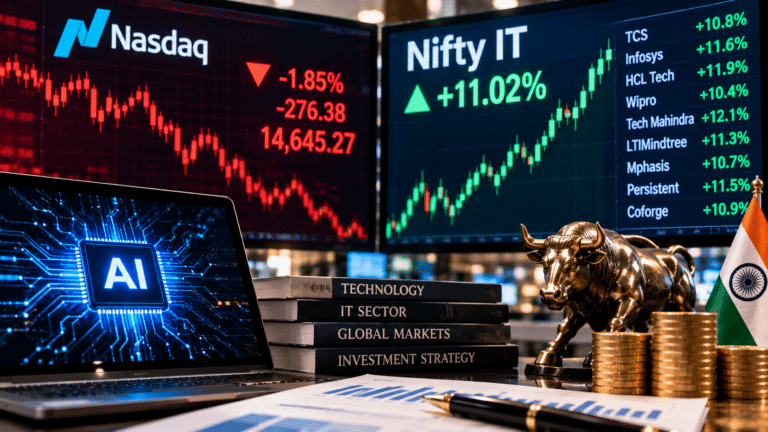
| Nasdaq Composite | 29,425 (US100) | -0.83% | Direct read-through to Indian IT. Nasdaq weakness reliably drags TCS, Infosys, HCL Tech and Wipro at the open. |
| Nikkei 225 | 65,645 | -0.99% | Asia’s largest market and the first regional cue each morning. Surged 3.30 percent intraday on 5 August before fading. |
| Hang Seng | Modestly firm | +0.18% | Proxy for China risk sentiment and for the emerging-market allocation split between India and China. |
| Shanghai Composite | 3,878 | +1.47% | Strength here can pull FPI money out of India and into China, a recurring 2026 headwind. |
| KOSPI | Firm | Higher | Semiconductor and export bellwether. Signals global tech demand and manufacturing orders. |
| FTSE 100 | 10,888 | +0.08% | Commodity and financial weighted, useful cross-check on the metals and energy trade. |
| DAX 40 | 26,126 | -0.29% | Europe’s industrial pulse, relevant to Indian auto-component and engineering exporters. |
| CAC 40 | 8,669 | +0.03% | Reinforces the European demand signal for Indian exporters. |
| ASX 200 | 9,237 | +0.10% | Commodity-heavy, a leading indicator for the metals complex that led Wednesday’s Indian tape. |
| GIFT Nifty | 24,674 | Premium approx. 40 pts | The single most direct pre-open signal for the Nifty 50 open. |
The non-equity variables that drive Dalal Street harder than any index
- Brent crude at 79.15 dollars, WTI at 74.82. The dominant swing factor for Indian inflation, the current account and the rupee. Falling crude is the strongest bullish input the market currently has.
- US 10-year Treasury at 4.613 percent. Elevated US yields raise the hurdle rate for allocating to emerging markets and are a structural cause of the FPI outflow.
- Dollar Index at 99.68. A softer dollar historically correlates with foreign inflows into Indian equities.
- Gold at 4,267 dollars an ounce, silver at 62.16. Precious metals near extraordinary levels, which is why silver jewellery has been posting triple-digit CPI inflation and pulling roughly 50 basis points into the headline number.
- USD/INR at 95.09. A four-week high for the rupee, easing imported inflation but removing the currency tailwind that flattered IT and pharma revenue.
Top 10 Stocks to Watch on NSE and BSE for 2026
This is a research watchlist built from Q1 FY27 filings, sector positioning and the macro setup described above. It is not a buy recommendation and it is not personalised advice. Valuation multiples move daily and the bands below are indicative for the sector and the current price context. Verify live P/E, PEG and dividend yield on NSE India or BSE India before you act on anything here.
| # | Stock | Price (5 Aug) | Valuation context | Div. yield band | Investment rationale and sector trigger |
|---|---|---|---|---|---|
| 1 | ICICI Bank | 1,443.60 | Mid-to-high teens P/E, PEG close to 1 | 0.7-1.0% | The cleanest large-bank compounder on the exchange. Q1 FY27 profit up 15.9 percent, NII up 12.7 percent, NIM steady at 4.36 percent, loan book up 19.6 percent to 16.31 lakh crore, provisions falling to 1,260 crore from 1,815 crore. Fee income surged 23.5 percent. Trigger: credit growth outpacing system average without asset-quality slippage. |
| 2 | Larsen & Toubro | 4,047.00 | Premium infra multiple, high thirties P/E | 0.7-1.0% | Up 11.54 percent over twelve months while the Sensex fell, and it led Wednesday’s Sensex gainers with a 1.43 percent move. Trigger: government capital expenditure remains the identified structural driver for manufacturing, and L&T is the purest listed proxy for it. Order book visibility is the metric to track. |
| 3 | Bharti Airtel | 1,964.00 | Elevated on trailing earnings, reasonable on EV/EBITDA | 0.5-0.8% | Beat Q1 FY27 expectations at 13.37 rupees per share. Telecom was among the sectors where domestic institutions added most aggressively in the last quarter. Trigger: ARPU expansion plus a consolidated three-player market with pricing power that no other Indian sector currently enjoys. |
| 4 | Sun Pharmaceutical | 1,944.50 | Low-to-mid thirties P/E, PEG above 1.5 | 0.7-1.0% | Up 21.90 percent over twelve months, the best one-year performer among Sensex heavyweights. Pharma is the defensive that has actually worked in 2026. Trigger: specialty portfolio scale-up and US generic pricing stabilisation. Wednesday’s 1.22 percent dip was sector rotation, not company news. |
| 5 | Maruti Suzuki | 14,165.00 | High twenties P/E, PEG near 1.3 | 0.8-1.2% | Up 13.10 percent in a year. Nifty Auto was among Wednesday’s leading sectors. Trigger: falling crude lowers running costs and lifts entry-level demand, while a stable repo rate keeps auto loan EMIs predictable. Rural recovery is the volume swing factor. |
| 6 | NTPC | Sensex constituent | Low-to-mid teens P/E, PEG below 1 | 2.0-2.8% | Rose 1.82 percent on Wednesday. The highest-yielding large-cap on this list and a genuine income holding. Trigger: India’s power demand growth plus a large renewable capacity pipeline. Regulated returns make earnings unusually predictable in a volatile tape. |
| 7 | State Bank of India | Sensex constituent | Mid-to-high single-digit P/E, below 1.5x book | 1.5-2.2% | Gained 1.7 percent on Wednesday. The cheapest way to own India’s credit cycle. Trigger: the crude collapse removed the largest identified source of PSU-bank NPA risk, which is precisely what powered the 3 August PSU banking surge that took Bank Nifty above 57,500 for the first time in six weeks. |
| 8 | JSW Steel | Nifty constituent | Cyclical, P/E unreliable at trough | 0.5-1.0% | Up 2.31 percent on Wednesday as Nifty Metal led all sectors with a 1.72 percent gain. Trigger: steel at 3,007 and iron ore firming 1.13 percent, alongside infrastructure spending. Cyclical, so position size accordingly and treat this as a trade rather than a hold. |
| 9 | Shriram Finance | Nifty constituent | Low-to-mid teens P/E, attractive PEG | 1.2-1.8% | The day’s top Nifty 50 gainer at 3.23 percent. NBFCs benefit disproportionately from a stable rate environment because their borrowing costs stop rising before their lending yields reset. Trigger: commercial vehicle financing demand tied directly to freight activity and infrastructure execution. |
| 10 | Reliance Industries | 1,280.00 | Low-to-mid twenties P/E on normalised earnings | 0.4-0.7% | The contrarian entry. Down 8.10 percent over a year and roughly 15 percent year to date. Q1 FY27 revenue rose 25.4 percent to 3.12 lakh crore, led by oil-to-chemicals. The 22.4 percent profit decline is entirely a base effect from a prior-year one-off gain, not operational deterioration. Trigger: retail and digital value unlocking, plus a de-rating that has already happened. |
Top 10 Gainers and Losers: 5 August 2026
| # | Stock | Change | Why it moved |
|---|---|---|---|
| 1 | Shriram Finance | +3.23% | NBFC re-rating on rate certainty. A hold at 5.25 percent locks in funding costs while asset yields stay firm. |
| 2 | Grasim Industries | +2.74% | Diversified play on cement, chemicals and the paints entry, benefiting simultaneously from cheaper crude inputs and infrastructure demand. |
| 3 | JSW Steel | +2.31% | Nifty Metal led all twenty-four sectors with a 1.72 percent gain as steel and iron ore firmed globally. |
| 4 | UltraTech Cement | +2.00% | Cement is the second-order beneficiary of falling energy costs, since coal and freight are the dominant cost lines. |
| 5 | Hindalco Industries | +1.96% | Aluminium and copper strength, with copper up 0.30 percent globally. Rode the same metals leadership as JSW. |
| 6 | NTPC | +1.82% | Defensive rotation into regulated-return utilities as investors reduced private bank exposure post-policy. |
| 7 | State Bank of India | +1.70% | PSU banks continued to outperform private peers on the crude-driven reduction in corporate NPA risk. |
| 8 | Mahindra & Mahindra | +1.70% | Nifty Auto among the top-performing sectors. Cheaper fuel plus stable EMIs supports the demand narrative. |
| 9 | Larsen & Toubro | +1.43% | Capex proxy. Infrastructure spending was reaffirmed as a structural growth driver in the policy commentary. |
| 10 | Bharti Airtel | +0.30% | Held gains after a strong June-quarter print, though the move faded from a much stronger opening. |
| # | Stock | Change | Why it moved |
|---|---|---|---|
| 1 | Tata Consultancy Services | -1.91% | The day’s heaviest drag. A firmer rupee removes the currency tailwind that made rupee revenue growth of 13.9 percent look far better than 2.7 percent dollar growth. |
| 2 | Apollo Hospitals | -1.55% | Healthcare sold off alongside pharma as money rotated into cyclicals. Valuation-driven profit-taking rather than news. |
| 3 | HCL Technologies | -1.45% | Followed TCS lower on the same currency logic, compounded by a 0.83 percent Nasdaq Composite decline overnight. |
| 4 | Bharat Electronics | -1.33% | Slipped to 386.30 rupees. Defence names came under pressure as the Iran-US thaw reduced the geopolitical risk premium. |
| 5 | Sun Pharmaceutical | -1.22% | Nifty Pharma among the laggards. Profit-taking after a 21.90 percent twelve-month run, not a fundamental change. |
| 6 | Jio Financial Services | -1.15% | Fell despite a 156 percent jump in Q1 FY27 profit to 830 crore rupees. Classic sell-the-news on an already-rich multiple. |
| 7 | HDFC Bank | -0.99% | Nifty Private Bank among the weakest sectors. Down close to 26 percent over twelve months on adjusted terms, the sector’s core margin problem in one stock. |
| 8 | Reliance Industries | -0.84% | Energy weakness. Cheaper crude helps the wider economy but compresses refining and oil-to-chemicals spreads. |
| 9 | ICICI Bank | -0.76% | Caught in the private bank de-rating despite the strongest Q1 print among the large lenders. Rotation, not results. |
| 10 | Hindustan Unilever | -0.60% | Nifty FMCG among the day’s laggards. The services PMI collapse to a 53-month low is a direct read-through to consumption volumes. |
Sector Performance India 2026: Where the Money Is Actually Going
| Sector | 5 Aug session | Q1 FY27 earnings signal | Primary driver | Stance |
|---|---|---|---|---|
| Metals | Leader, +1.72% | Cyclical recovery visible in JSW Steel and Hindalco price action | Global steel at 3,007, iron ore up 1.13%, infrastructure capex | Momentum positive |
| Auto | Outperformer | Maruti up 13.10% over twelve months | Falling fuel costs, stable EMIs, rural demand recovery | Constructive |
| Realty | Outperformer | Godrej Properties up 3.22% in the session | Rate hold plus the proposed depository-receipt framework for REITs and InvITs | Improving |
| PSU Banks | Firm, SBI +1.70% | Credit growth healthy, asset quality stable | Crude collapse removed the largest corporate NPA risk | Preferred over private |
| Private Banks | Laggard | ICICI profit +15.9%, NIM 4.36%, loans +19.6% (strong but sold) | Margin compression from a prolonged hold at 5.25% | Selective only |
| Information Technology | Laggard | TCS revenue +13.9% in rupees but only +3.2% constant currency; TCV 9.5bn dollars; margin 24.0% | Rupee strength removes the reporting cushion; Nasdaq weakness | Structurally challenged |
| Pharma / Healthcare | Laggard | Sun Pharma still up 21.90% over twelve months | Rotation out of defensives into cyclicals | Accumulate on weakness |
| FMCG / Consumer | Laggard | HUL down 17.81% over twelve months; Marico off 2.79% in the session | Services PMI at a 53-month low; food inflation at 5.32% | Wait for volume recovery |
| Media | Worst, -1.58% | Advertising spend tied to consumption weakness | Discretionary ad budgets are the first line cut in a slowdown | Avoid |
| Capital Goods / Infra | Firm, L&T +1.43% | Order visibility intact | Public infrastructure expenditure named a critical structural driver | Core holding |
| Telecom | Steady | Bharti Airtel EPS 13.37, ahead of expectations | Consolidated market structure with genuine pricing power | Quality compounder |
| Energy / Oil & Gas | Mixed to weak | ONGC missed at 9.46 EPS; RIL profit -22.4% on base effect | Falling crude compresses upstream realisations | Downstream over upstream |
The single clearest signal in that table: everything that benefits from cheaper energy went up, and everything that benefits from a weak rupee went down.
That is the whole rotation in one sentence. Metals, autos, cement, realty and infrastructure are energy-cost and rate-sensitive plays that just got two pieces of good news at once. IT and pharma are dollar-revenue exporters that just lost their currency cushion as the rupee climbed to a four-week high. FMCG sits outside both trades and is being punished separately for the demand slowdown that the PMI data made impossible to ignore.
Section 10Analysis and Recommendations: Portfolios Built for Three Risk Appetites
The macro setup argues for a specific posture rather than a directional bet. Growth is decelerating from exceptional to good. Inflation is rising but the central bank thinks it is temporary. Rates are on hold with a genuine chance of a cut in October. Foreign money is leaving and domestic money is more than replacing it. Crude is falling and the rupee is stabilising. That combination favours domestic cyclicals over exporters, and quality over momentum.
Conservative portfolio: capital preservation with income
Suggested tilt: around 40 percent large-cap financials and utilities, 25 percent FMCG and pharma, 20 percent debt or liquid funds, 15 percent gold or a gold ETF.
Anchor names: NTPC for its 2 to 2.8 percent yield band and regulated returns, ICICI Bank for the cleanest bank balance sheet in the large-cap universe, Sun Pharma as the defensive that has actually delivered a 21.9 percent twelve-month return, and HDFC Bank purely as a valuation recovery play at deeply de-rated levels.
Pros: Predictable dividend income, low drawdown in volatile sessions, and gold exposure at a moment when bullion sits near 4,267 dollars an ounce. Cons: You will underperform badly if the metals and infrastructure cycle extends, and FMCG exposure is a live drag while consumption stays soft.
Balanced portfolio: growth with guardrails
Suggested tilt: around 35 percent banking and NBFCs, 25 percent capital goods and infrastructure, 15 percent auto, 15 percent IT or pharma, 10 percent cash held deliberately for volatility.
Anchor names: ICICI Bank and SBI across the credit cycle, L&T as the direct capex proxy, Maruti Suzuki for the consumption recovery, Shriram Finance for NBFC rate sensitivity, and a small IT position sized as a contrarian bet rather than a conviction holding.
Pros: Diversified across the two engines the RBI itself identified, consumption and investment, with a cash buffer that lets you buy the 24,400 support test if it comes. Cons: Requires active rebalancing, and the IT allocation is a genuine drag until the constant-currency growth line inflects.
Aggressive portfolio: cycle-led, higher beta
Suggested tilt: around 30 percent metals and commodities, 25 percent midcap and smallcap, 20 percent PSU banks, 15 percent realty and infrastructure, 10 percent cash.
Anchor names: JSW Steel and Hindalco on the metals leadership, SBI and PSU banking on the crude-driven NPA relief, Godrej Properties for realty, plus midcap momentum in names like Mphasis, Ashok Leyland and Jubilant FoodWorks that showed genuine buying interest in the session.
Pros: Maximum leverage to the current rotation, and smallcaps have outperformed the frontline for several consecutive sessions. Cons: Metals are cyclical and mean-reverting, smallcap liquidity evaporates in a correction, and any renewed Middle East escalation reverses the entire crude thesis overnight.
The entire constructive case rests on crude staying near 79 dollars. The Strait of Hormuz reopening is partial, fresh Red Sea incidents are still being reported, and Brent moved more than 6 percent in a single session on 3 August on a headline alone. If oil returns to the mid-nineties, CPI transport inflation reaccelerates, the October rate cut disappears, the rupee resumes falling, and the metals and autos leadership unwinds within days. Size positions with that scenario in mind.
Stock Recommendations for Today: The Point-by-Point Trading Plan
- Respect the expiry. Thursday is weekly F&O expiry. Directional conviction is lowest and intraday whipsaw is highest on these days. If you are a positional investor, this is a day to do nothing rather than a day to be clever.
- Trade the level, not the narrative. Nifty support sits at 24,500 to 24,400 with pivots at 24,531, 24,489 and 24,420. Resistance is layered at 24,669, 24,711 and the decisive 24,700 to 24,800 band. Nothing meaningful happens until one of those breaks on a closing basis.
- Stay with the metals leadership while it lasts. Nifty Metal was the top sector at 1.72 percent with JSW Steel up 2.31 percent and Hindalco up 1.96 percent. Trend-followers can stay long. Trail stops rather than adding at these levels, because commodity leadership rarely runs more than a few weeks unbroken.
- Accumulate PSU banks on dips, not on breakouts. SBI’s 1.7 percent gain and the wider PSU strength trace directly to the crude-driven NPA relief. Bank Nifty holding 57,500 is the confirmation signal. Buy weakness toward that level, not strength away from it.
- Do not average down on IT yet. TCS at minus 1.91 percent and HCL Tech at minus 1.45 percent are not oversold bounces waiting to happen. The rupee has strengthened to a four-week high, constant-currency growth is 3.2 percent, and the Nasdaq fell 0.83 percent overnight. Wait for a constant-currency inflection, not a price level.
- Treat private banks as a valuation opportunity with a time cost. ICICI Bank delivered a 15.9 percent profit rise and fell 0.76 percent. That disconnect resolves eventually, but the catalyst is an October rate cut, which is two months of holding away.
- Avoid defence and geopolitical-premium names on strength. BEL’s 1.33 percent decline is a direct function of the Iran-US thaw. These positions are effectively a short on peace, and peace headlines are currently winning.
- Keep FMCG on the watchlist, not in the portfolio. Food inflation at 5.32 percent compresses margins while the services PMI at a 53-month low compresses volumes. That is both blades of the scissors. Re-enter when one of them turns.
- Watch the FII flow reversal carefully. Foreign investors bought 2,446.47 crore rupees on 4 August while domestic institutions sold 936.14 crore. Monthly FII outflows have collapsed from 70,135 crore in April to about 6,056 crore in July. If that turns into sustained buying, it is the strongest bullish signal available for the second half of 2026.
- Keep 10 to 15 percent in cash. With the index 8.8 percent below its December 2025 record and support only 200 points below current levels, dry powder has real option value right now.
Questions Indian Investors Are Asking This Week
Will the RBI cut the repo rate in October 2026?
It is live but not assured. The MPC meets 5 to 7 October. The case for a cut is that the RBI lowered its FY27 inflation forecast to 5 percent while raising growth to 6.7 percent, and the governor explicitly described the current inflation rise as food and fuel driven with no generalisation. The case against is that headline CPI at 4.38 percent is already above the 4 percent target and rising. Watch the July and August CPI prints and the monsoon.
Why is the Sensex down over a year while the Nifty is flat?
Composition. The Sensex is more concentrated in financials, energy and IT megacaps, and all three have de-rated. TCS is down over 20 percent, Infosys over 18 percent, Reliance over 8 percent and HUL close to 18 percent across twelve months. The Nifty’s broader exposure to metals, autos, cement and NBFCs has cushioned it.
Is the FII selling a reason to exit Indian equities?
The scale is real but the absorption has been remarkable. Roughly 2.7 lakh crore rupees of foreign selling in 2026 has been met with more than 4.16 lakh crore of domestic buying. DII ownership of Nifty 500 companies is at a record 21 percent while FII ownership has fallen to 17 percent. The market has structurally changed who sets the price.
Which sector looks best positioned for the rest of 2026?
On the current evidence, domestic cyclicals tied to infrastructure and energy costs: metals, capital goods, autos, cement and PSU banks. The sectors to be most careful with are IT, where the rupee tailwind has reversed, and FMCG, where the demand signal in the PMI data is the weakest in over four years.
What single indicator should a retail investor track daily?
Brent crude. It sets Indian CPI transport inflation, the current account, the rupee, the RBI’s room to cut, PSU bank asset quality and the entire metals and autos trade. One number, six transmission channels.
In closingFinal Thought: The Market Told You Everything on a Day It Barely Moved
A 152-point Sensex gain and a 9.75-point Nifty gain look like a market with nothing to say. They were, in fact, the noisiest quiet session of the month.
Here is what the data actually established. India ended FY26 growing at 7.7 percent, the fastest major economy for a fourth straight year, and is now handing off to an FY27 the RBI puts at 6.7 percent. That deceleration is real, but the central bank raised the number rather than lowering it. Inflation has turned upward to 4.38 percent, above target for the first time in six months, entirely on food and fuel, and the RBI responded by cutting its FY27 forecast to 5 percent. That asymmetry is the most dovish thing in an officially neutral policy, and it is the reason October remains genuinely open.
Meanwhile, the composition of the market has changed permanently. Domestic institutions now own 21 percent of Nifty 500 companies against foreign investors at 17 percent, a gap that has widened for nine consecutive quarters. A 58 billion dollar foreign exodus over 22 months that would have broken the market a decade ago has been absorbed by 166 billion dollars of domestic buying and SIP flows averaging around three billion dollars a month. Indian households, not global allocators, are now the marginal price setter on Dalal Street.
The rotation on Wednesday was not random. Metals gained 1.72 percent and media lost 1.58 percent because cheaper crude and a firmer rupee reward completely different companies. Everything leveraged to falling energy costs and domestic capex rose. Everything leveraged to a weak rupee and export demand fell. That is not sentiment, that is arithmetic, and it will keep working until crude moves.
Three numbers to carry into the rest of August: 24,500 on the Nifty, below which the short-term bias flips to sellers. 57,500 on Bank Nifty, the flip level that decides whether the banking recovery is real. And 79 dollars on Brent, the variable that quietly determines all of the above. The Sensex is 8.8 percent below its December 2025 record of 86,159. Getting back there requires either an earnings acceleration or a rate cut. Right now, the second looks more likely than the first, and the market is positioning for it one sector at a time.
Disclaimer. This briefing is published for information and educational purposes only and does not constitute investment advice, a recommendation, or an offer to buy or sell any security. All index levels, prices, earnings figures and macroeconomic data reflect officially reported information as of the 5 August 2026 close and the 6 August 2026 pre-open, and may be revised. Valuation bands including P/E, PEG and dividend yield are indicative and change daily. Verify all figures directly with NSE India, BSE India, the Reserve Bank of India and company filings before making any decision. Equity investments carry market risk, including the possible loss of principal. Past performance does not indicate future results. Consult a SEBI-registered investment adviser for guidance suited to your own financial situation, time horizon and risk tolerance.