Can Sensex and Nifty 50 Extend Friday's 1.3% Comeback as CPI Data, TCS Momentum and FII Selling Collide?
Can Sensex and Nifty 50 Extend Friday’s 1.3% Comeback as CPI Data, TCS Momentum and FII Selling Collide?
Quick Summary: The Numbers Driving Monday’s Session
- BSE Sensex: 72,472.33, up 879.09 points (1.23%) at the close on Friday, 9 October 2026
- NSE Nifty 50: 22,520.45, up 288.65 points (1.30%) at the close on 9 October 2026
- Nifty Bank: 55,256.65, up 741.60 points (1.36%)
- India VIX: 14.35, down 6.07% on 9 October
- Institutional flows (1 to 7 October, NSE provisional): FIIs net sold ₹23,266.03 crore while DIIs net bought ₹24,908.95 crore
- Top sector: Nifty IT, up 3.02% to 28,574.90 after TCS Q2 FY27 results
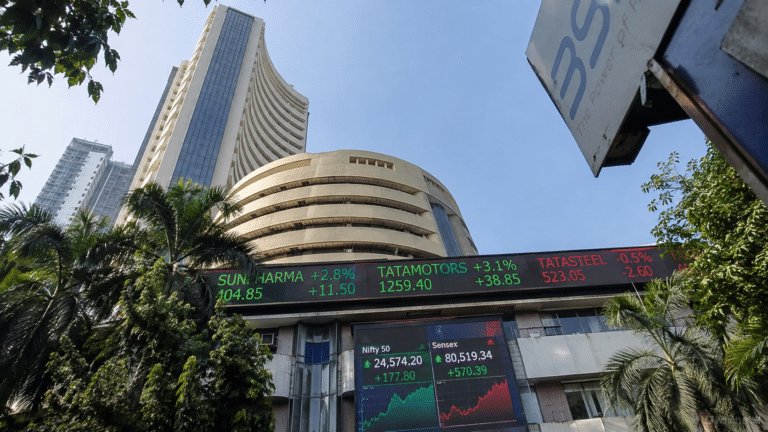
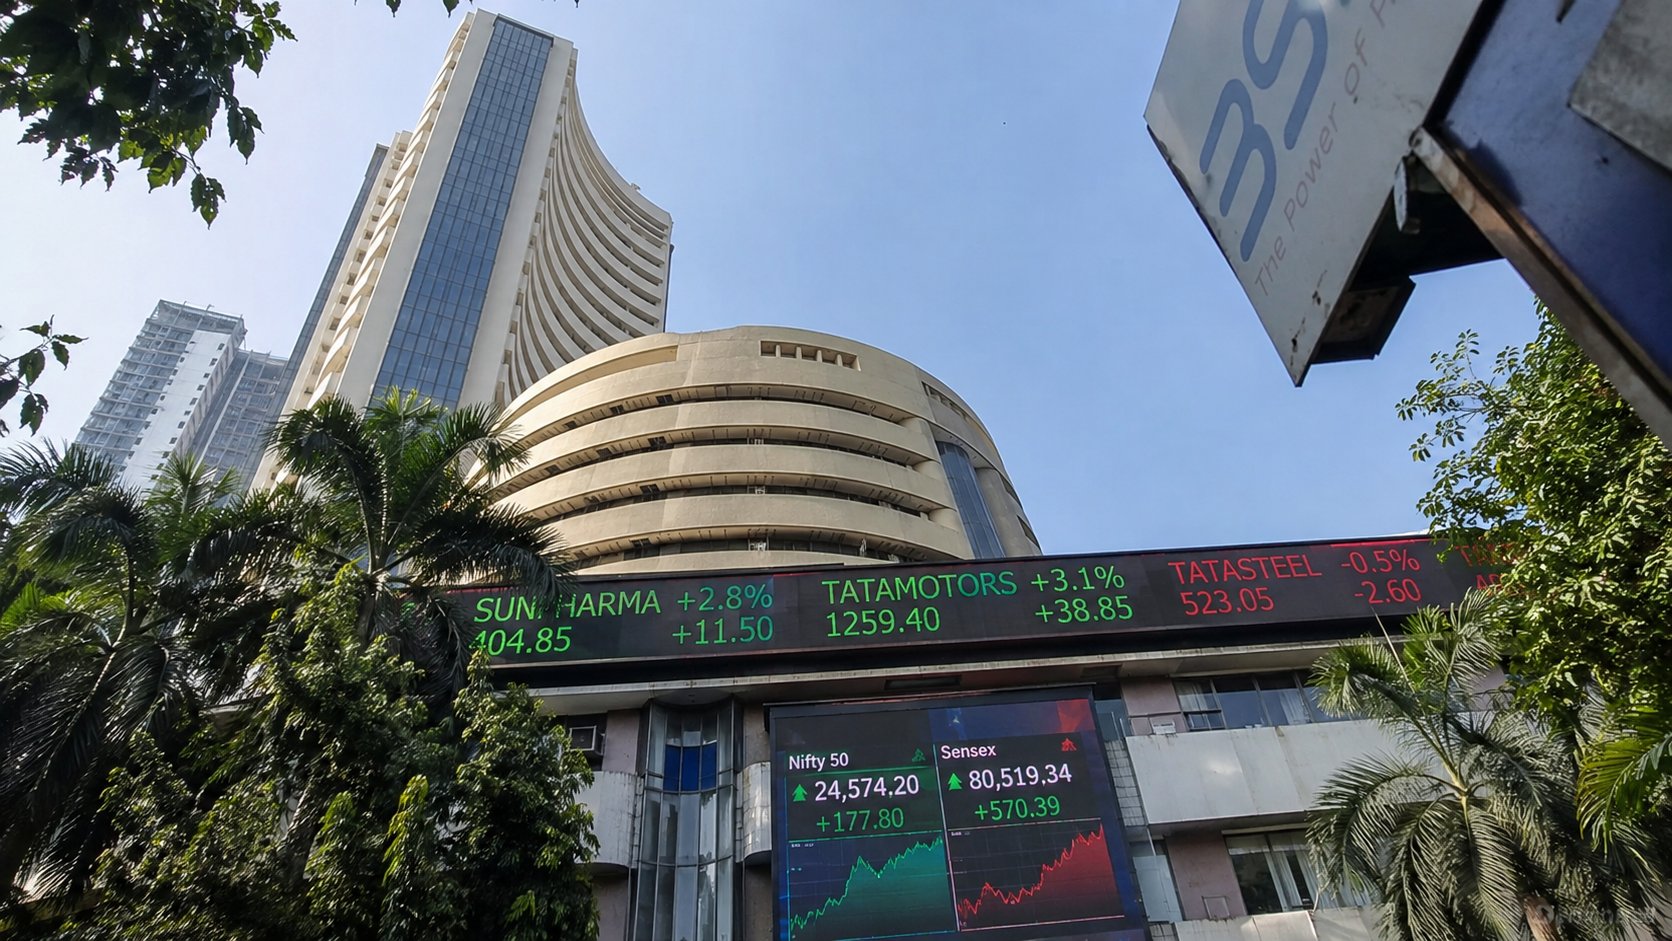
Eight straight weekly losses, the longest such run in 25 years according to Anand Rathi, ended in a single session. On Friday, 9 October 2026, the NSE Nifty 50 posted its sharpest one-day rally in more than two months and the BSE Sensex added 879 points, turning a bruising week into a 0.44% weekly gain for the Nifty and 0.78% for the Sensex.
So is this the start of a genuine bottom, or a relief bounce that fades the moment foreign investors resume selling? This exclusive Dalal Street briefing for Monday, 12 October 2026 answers exactly that. You will get the verified closing data behind the stock market today, the macro drivers from GDP to CPI inflation and RBI repo rates, the Nifty levels that matter, global cues, sector performance India 2026, Nifty 50 gainers and losers, and practical portfolio ideas for every risk appetite.
Time reference: all index and stock prices in this briefing are as of market close on Friday, 9 October 2026, the latest completed session, unless a different time is stated. Monday’s pre-open signal comes from GIFT Nifty.
Indian Market Overview: Did Friday’s Short-Covering Rally Change the Trend for Sensex and Nifty 50?
The rebound came right after Thursday’s sell-off, when the Nifty fell 1.64% to 22,231.80, a fresh 2026 low, and India VIX jumped 10.38% to 15.33. Friday reversed almost all of that damage, with buying in IT, FMCG, banks and autos.
| Indicator | Close (9 Oct 2026) | Change | Intraday Range |
|---|---|---|---|
| BSE Sensex | 72,472.33 | +879.09 (+1.23%) | 71,739.49 to 72,669.20 |
| NSE Nifty 50 | 22,520.45 | +288.65 (+1.30%) | 22,294.75 to 22,580.75 |
| Nifty Bank | 55,256.65 | +741.60 (+1.36%) | 54,617.20 to 55,419.30 |
| Nifty Financial Services | 24,968.50 | +328.05 (+1.33%) | Prior close 24,640.45 |
| Nifty IT | 28,574.90 | +838.30 (+3.02%) | Top sector of the day |
| India VIX | 14.35 | -6.07% | Down from 15.33 on 8 Oct |
Market Breadth and Broader Indices: Was the Bounce Broad-Based?
- Nifty 50 breadth: 46 advances against only 4 declines, according to 5paisa Research.
- Sensex breadth: 29 of 30 stocks closed higher; Reliance Industries (down 0.55% on BSE) was the lone laggard.
- Nifty Bank breadth: 13 constituents rose and only IndusInd Bank (down 0.27%) slipped.
- Broader market: Nifty Midcap 100 gained 1.56% and Nifty Smallcap 100 rose 0.54%, per Kotak Neo, after both had fallen more than 2% on Thursday.
- Derivatives: October F&O contracts expire on 27 October 2026.
FII and DII Flows: Who Is Absorbing the Foreign Selling?
Foreign selling has been relentless this month, and domestic institutions have absorbed almost every rupee of it. The provisional cash-market numbers below are from NSE data compiled by Trendlyne.
| Date | FII Net (₹ crore) | DII Net (₹ crore) | Nifty Close |
|---|---|---|---|
| 1 Oct 2026 | -9,484.22 | +10,041.84 | 22,421.95 |
| 5 Oct 2026 | -4,699.14 | +5,181.62 | 22,555.75 |
| 6 Oct 2026 | -2,961.30 | +5,088.92 | 22,776.10 |
| 7 Oct 2026 | -6,121.37 | +4,596.57 | 22,603.05 |
| Total, 4 sessions | -23,266.03 | +24,908.95 | Nifty down 0.08% vs 30 Sep |
Depository data tells the same story. NSDL figures released on 9 October showed FIIs as net sellers of ₹12,884.07 crore in equities and ₹2,352.81 crore in debt. For context, Kotak Neo data shows FIIs pulled out ₹1,22,540.41 crore in March 2026 alone, while DIIs put in ₹1,42,960.37 crore that month.
Investor Sentiment: Cautiously Constructive, Not Euphoric
Anand Rathi describes the bias as cautiously constructive, citing a triple bullish divergence that hints at a potential bottoming process. Goodreturns notes that Friday’s strong bullish candle stayed inside Thursday’s range and came off the April 2026 low of 22,182, while warning that sustained FII selling could cap the upside.
Our read: the Sensex closed just 1.65% above its 52-week low of 71,292.88 and still sits 15.89% below its 52-week high of 86,159.02. That is a market priced for bad news, which is precisely when relief rallies can surprise.
Key Economic Drivers: Is India’s Strong GDP Story Being Drowned Out by Inflation and a Rate Hike?
Here is the paradox of October 2026: India’s economy is growing faster than almost every forecast, yet the Nifty is near its yearly low. The reason lies in inflation, crude oil, the rupee and a central bank that has just turned hawkish.
India GDP Growth Trajectory: 7.8% in Q1 FY27
- Headline growth: MoSPI data shows real GDP grew 7.8% in April to June 2026 (Q1 FY27), up from 6.9% a year earlier and ahead of the RBI’s 7% estimate.
- Size of the economy: real GDP was ₹81.36 lakh crore; nominal GDP grew 10.3% to ₹88.27 lakh crore.
- Investment boom: gross fixed capital formation rose 11.9%, against 5.8% a year ago. Real GVA grew 8.2% and manufacturing value added 9.2%.
- Revision: Q4 FY26 growth was revised up to 8.6% from 7.8%.
- Next release: Q2 FY27 GDP is scheduled for 30 November 2026. In its October policy, the RBI raised its FY27 growth forecast to 7.1%.
What this means for markets: strong earnings support for banks, capital goods, cement and infrastructure names, which is why dips in these sectors keep attracting domestic money.
CPI Inflation Trend: Food Prices Are Back in Charge
- CPI inflation for August 2026: 4.82% (provisional, base 2024=100), up from 4.45% in July, according to MoSPI.
- Food inflation: 5.95%, up from 5.52%; rural CPI at 5.23% versus urban at 4.31%.
- Hot spots: silver jewellery inflation at 107.11%, ginger 73.82% and onion 48.27%; tomato prices fell 31.09%.
- Forward view: ICRA expects food and beverage inflation to rise close to 7% in September 2026.
- Today’s trigger: MoSPI’s schedule lists CPI for September 2026 for release on 12 October 2026, after market hours.
What this means for markets: a print above August’s 4.82% would strengthen the case for another hike in December and pressure rate-sensitive stocks such as NBFCs, realty and autos.
RBI Monetary Policy: First Repo Rate Hike Since February 2023
- Decision on 7 October 2026: the MPC voted unanimously to raise the repo rate by 25 basis points to 5.50%.
- Corridor: the Standing Deposit Facility rate moved to 5.25%; the MSF rate and Bank Rate to 5.75%.
- Stance: changed from neutral to calibrated tightening by a 4 to 2 majority.
- Projections: FY27 CPI inflation forecast raised to 5.2%; GDP growth forecast raised to 7.1%.
- Street view: Nomura and SBI Research had both expected a hike in October followed by another in December, which would take the repo rate to 5.75%. MPC minutes are due on 21 October.
What this means for markets: borrowing costs are rising while growth is strong. Banks with healthy deposit franchises tend to cope better than NBFCs that depend on wholesale funding.
Unemployment Data (PLFS): Jobs Market Holding Steady
- August 2026 PLFS: overall unemployment for persons aged 15 and above eased to 5.0% from 5.1% in July.
- Rural vs urban: rural unemployment fell to 4.1%, the lowest since January 2026, while urban unemployment edged up to 6.8%.
What this means for markets: steady rural jobs support consumption names in FMCG and two-wheelers, which helps explain why Nifty FMCG rose 2.20% on Friday.
Nifty Today: The Exact Levels Every Trader Should Watch on 12 October
Where does the Nifty 50 go after its biggest single-day rally in two months? Here is the point-by-point technical map built from Friday’s verified price action.
- Open: 22,314.95
- High: 22,580.75
- Low: 22,294.75
- Close: 22,520.45, up 288.65 points (1.30%)
- Classic pivot (our calculation from Friday’s high, low and close): 22,465.32, with R1 at 22,635.88, R2 at 22,751.32, S1 at 22,349.88 and S2 at 22,179.32.
- Support zones: 22,480 to 22,500 immediate, then 22,221.85 (5paisa Research); 22,212 and 22,020 per the 5paisa outlook; 22,200 to 21,900 per Anand Rathi.
- Resistance zones: 22,580 to 22,635 first, then 22,800 to 22,950 (5paisa); 22,829 and 23,021 on the outlook grid; 22,800 to 23,200 per Anand Rathi.
- Momentum: daily RSI at 36.50, hourly RSI at 51.18 and 15-minute RSI at 56.85. The index remains below its key EMAs, with the short-term average near 22,635.
- Candlestick pattern: a strong bullish candle that stayed within Thursday’s range, effectively a bullish harami-style recovery from the April 2026 low zone.
- Trend verdict: short-term momentum has turned up, but the medium-term trend stays down while Nifty trades below 22,950.
- Outlook for the session: GIFT Nifty indicated a firmer start, trading around 22,645 early Monday. A hold above 22,635 opens 22,800; a slip below 22,480 would bring 22,221.85 back into play.
BSE Sensex vs Nifty 50: October 2026 Session-by-Session Scorecard
How has the month unfolded so far? The table tracks every October trading session against the 30 September close (Sensex 72,480.29, Nifty 22,620.45). Markets were shut on 2 October for Gandhi Jayanti.
| Date | Sensex Close | Sensex Day % | Nifty 50 Close | Nifty Day % | Sensex MTD % | Nifty MTD % |
|---|---|---|---|---|---|---|
| 30 Sep 2026 | 72,480.29 | -0.07% | 22,620.45 | -0.42% | Base | Base |
| 1 Oct 2026 | 71,909.70 | -0.79% | 22,421.95 | -0.88% | -0.79% | -0.88% |
| 5 Oct 2026 | 72,382.47 | +0.66% | 22,555.75 | +0.60% | -0.13% | -0.29% |
| 6 Oct 2026 | 73,067.81 | +0.95% | 22,776.10 | +0.98% | +0.81% | +0.69% |
| 7 Oct 2026 | 72,638.70 | -0.59% | 22,603.05 | -0.76% | +0.22% | -0.08% |
| 8 Oct 2026 | 71,593.24 | -1.44% | 22,231.80 | -1.64% | -1.22% | -1.72% |
| 9 Oct 2026 | 72,472.33 | +1.23% | 22,520.45 | +1.30% | -0.01% | -0.44% |
The Sensex has essentially gone nowhere in October, finishing Friday just 0.01% below its September close, while the broader Nifty is down 0.44%. The Nifty has been the more volatile gauge on both sides, falling harder on Thursday and bouncing harder on Friday. Headline stability is masking heavy churn underneath.
Latest Market News Highlights: 7 Triggers Moving Dalal Street Right Now
TCS kicks off Q2 earnings with a beat
- What happened: TCS reported Q2 FY27 consolidated revenue of ₹73,188 crore, up 11.2% year on year, and net profit of about ₹13,884 crore, up roughly 15%. Operating margin stood at 24% and annualised AI services revenue crossed $3.1 billion.
- Impact and stocks affected: Nifty IT jumped 3.02%; TCS, Infosys, HCL Technologies and Tech Mahindra led the rally.
TCS declares ₹12 second interim dividend
- What happened: The board declared ₹12 per share, taking FY27 interim payouts to ₹24. Record date is 14 October 2026 and payment is due on 30 October.
- Impact and stocks affected: Under T+1 settlement, 13 October is the last day to buy for eligibility. Note that TCS shares were down about 35% in 2026 as of early October, per Business Today.
RBI hikes repo rate to 5.50%
- What happened: The MPC raised rates by 25 bps on 7 October and shifted to calibrated tightening, citing inflation, West Asia risks, elevated crude and a weaker rupee.
- Impact and stocks affected: Rate-sensitive sectors such as realty, NBFCs and autos have lagged; banks with strong deposit bases are better placed.
Crude eases on US-Iran headlines
- What happened: Brent moved towards $103 per barrel on Friday after trading above $105 on Thursday. Kotak Neo reported that oil retreated after President Trump said the US would not attack Iran before the 3 November mid-term polls.
- Impact and stocks affected: Relief for oil marketing companies, paints, aviation and the current account; ONGC and upstream names lose some tailwind.
Rupee stays under pressure near 96.73
- What happened: The rupee closed at ₹96.73 per US dollar on 9 October versus about ₹96.78 a day earlier, still weaker on the week despite the rate hike.
- Impact and stocks affected: Supports IT and pharma exporters; raises import costs for oil, electronics and capital goods.
Global Cues: How Wall Street, Asia and Europe Set the Tone for Indian Markets
Wall Street closed out a record-setting week on Friday while Asia was mixed and Korea was shut for a holiday. Here is the global scoreboard.
| Index | Latest Close / Level | Change | Time Reference |
|---|---|---|---|
| Dow Jones | 51,654.95 | +0.8% | Close, Fri 9 Oct |
| S&P 500 | 7,811.54 | +0.6% | Close, Fri 9 Oct |
| Nasdaq Composite | 27,366.17 | +0.6% | Close, Fri 9 Oct |
| GIFT Nifty | About 22,645 | About 0.55% above Nifty spot | Early trade, Mon 12 Oct |
| Nikkei 225 | 69,030.92 | -0.02% | Close, Fri 9 Oct |
| Hang Seng | 24,211.35 | +1.79% | Close, Fri 9 Oct |
| Shanghai Composite | 3,813.79 | +0.05% | Close, Fri 9 Oct |
| KOSPI | 6,625.93 | -2.62% | Close, Thu 8 Oct (Korea shut 9 Oct) |
| FTSE 100 | 10,536.62 | +0.91% | Afternoon trade, Fri 9 Oct |
| DAX | 25,069.23 | +1.06% | Afternoon trade, Fri 9 Oct |
| CAC 40 | 7,786.71 | +0.74% | Afternoon trade, Fri 9 Oct |
| Macro Gauge | Level | Move / Note |
|---|---|---|
| US Dollar Index | 102.10 | -0.14% (US close, 8 Oct) |
| US 10-year Treasury yield | 5.24% | Rose on Friday after swings |
| Brent crude | About $103 per barrel | Down from above $105 on 8 Oct |
| Gold (COMEX) | $4,158.30 per ounce | +0.43% (US close, 8 Oct) |
| USD/INR | 96.73 | Rupee firmer by about 5 paise on 9 Oct |
- Wall Street: the S&P 500 is up 14.1% in 2026 and the Nasdaq 17.7%. A risk-on US tape supports Indian IT stocks, which earn most of their revenue in dollars.
- GIFT Nifty: trading about 125 points above Friday’s Nifty close signals a positive opening bias.
- Asia and Europe: Hong Kong rose 1.79% and European indices gained about 1%, while a flat Nikkei and a Korean holiday limited spillover.
- US bond yields at 5.24%: this is the single biggest headwind for FII flows into India. High risk-free returns in the US keep foreign money cautious.
- Crude near $103: every dollar matters for India’s import bill; the pullback from $105 was a key trigger for Friday’s rally.
Performance Overview: Top NSE and BSE Stocks Across 12 Data-Backed Screens
Which stocks deserve a place on your watchlist this week? Every price below is a verified close from 9 October 2026 unless an intraday time is noted. Valuation data (P/E, market capitalisation, EPS) comes from the 5paisa Nifty 50 list updated at 3:57 PM on 9 October.
Daily Fresh Breakouts: Friday’s Strongest Momentum Leaders
Screening criteria: largest one-day percentage gains in the Nifty 50 on 9 October, on a day with 46 advances and 4 declines.
| Stock | CMP ₹ | Change % | Key Metric | Why It Qualifies |
|---|---|---|---|---|
| Apollo Hospitals | 8,027.50 | +4.72% | P/E 73.00 | Top Nifty gainer; healthcare defensives in demand |
| ITC | 266.00 | +4.31% | P/E 17.47 | Led FMCG’s 2.20% sector gain |
| Eicher Motors | 7,050.00 | +4.17% | P/E 36.53 | Auto rebound after Thursday’s sector-wide sell-off |
| TCS | 2,156.00 | +3.85% | P/E 14.11 | Q2 FY27 profit up about 15% YoY |
| HCL Technologies | 1,216.70 | +3.38% | P/E 18.11 | Sympathy buying after TCS results |
Weekly Breakouts and Volume Shockers: Where Unusual Activity Showed Up
Screening criteria: BSE ‘A’ group stocks this week that traded several times their one-month average volume during intraday surges, as reported by Capital Market. Prices are intraday at the time stated.
| Stock | Price ₹ (time) | Change % | Key Metric | Why It Qualifies |
|---|---|---|---|---|
| Alkyl Amines Chemicals | 2,017.65 (6 Oct, 11:45 AM) | +16.65% | 67,424 shares vs 3,075 average | Volume about 22 times normal |
| Trent | 2,860.20 (6 Oct, 11:45 AM) | +11.08% | 2.5 lakh shares vs 87,995 average | Closed Friday at ₹2,918.20, above three moving averages |
| Senco Gold | 344.30 (8 Oct, 11:45 AM) | +7.08% | 26.12 lakh shares vs 56,873 average | Over 45 times normal volume |
| LIC Housing Finance | 538.85 (8 Oct, 11:45 AM) | +4.05% | 30.22 lakh shares vs 1.47 lakh average | About 20 times normal volume |
| Alok Industries | 9.16 (8 Oct, 11:45 AM) | +10.36% | 53.68 lakh shares vs 18.16 lakh average | Nearly 3 times normal volume |
Oversold Signals: Is the Whole Market in the Bargain Zone?
Screening criteria: index-level momentum and distance from 52-week extremes, the clearest verified oversold markers available.
| Index | Level | Change % | Key Metric | Why It Qualifies |
|---|---|---|---|---|
| Nifty 50 | 22,520.45 | +1.30% | Daily RSI 36.50 | Bounced from deeply oversold territory |
| BSE Sensex | 72,472.33 | +1.23% | RSI(14) 38.6 | Only 1.65% above 52-week low of 71,292.88 |
| Nifty Bank | 55,256.65 | +1.36% | 52-week range 49,910.85 to 61,764.85 | 10.54% below its 52-week high |
| India VIX | 14.35 | -6.07% | 52-week range 8.72 to 28.91 | Fear gauge easing from Thursday’s spike |
Stocks Nearing Breakout: Names Testing Key Levels
Screening criteria: Nifty 50 stocks that rallied strongly on 9 October and, per 5paisa stock reports, closed near the session high or above key moving averages.
| Stock | CMP ₹ | Change % | Key Metric | Why It Qualifies |
|---|---|---|---|---|
| UltraTech Cement | 10,675.00 | +2.39% | P/E 41.16 | Closed near the session high |
| Trent | 2,918.20 | Weekly gainer | P/E 74.24 | Closed above three moving averages |
| Titan Company | 4,410.00 | +1.16% | P/E 72.91 | Annual return still positive in a weak market |
| Adani Ports | 1,761.00 | +3.10% | Market cap ₹4,05,496.80 crore | Third-largest Sensex gainer at +3.36% on BSE |
| Shriram Finance | 940.45 | +2.53% | P/E 19.62 | Led FinNifty gains alongside ICICI Lombard |
FII and DII Flow Tracker: The Tug of War Behind Every Tick
Screening criteria: daily NSE provisional cash-market flows. Company-level shareholding for the September 2026 quarter is filed within 21 days of quarter-end, so these flows are the freshest verified institutional signal.
| Session | FII Net ₹ crore | DII Net ₹ crore | Combined ₹ crore | Signal |
|---|---|---|---|---|
| 1 Oct 2026 | -9,484.22 | +10,041.84 | +557.62 | DIIs fully absorbed FII selling |
| 5 Oct 2026 | -4,699.14 | +5,181.62 | +482.48 | Market rose 0.60% |
| 6 Oct 2026 | -2,961.30 | +5,088.92 | +2,127.62 | Strongest net inflow; Nifty +0.98% |
| 7 Oct 2026 | -6,121.37 | +4,596.57 | -1,524.80 | Net outflow on RBI hike day |
| NSDL equity (released 9 Oct) | -12,884.07 | Not part of NSDL data | FII only | Heavy foreign exit continues |
Upcoming Dividends: Record Dates This Week
Screening criteria: dividends formally declared by the board with a record date in the coming week. Under T+1, buy before the record date to qualify.
| Stock | CMP ₹ | Change % | Dividend | Record Date |
|---|---|---|---|---|
| TCS | 2,156.00 | +3.85% | ₹12 second interim (₹24 FY27 so far) | 14 Oct 2026 (payment 30 Oct) |
| Vedanta | 255.10 (8 Oct, 3:28 PM) | -2.41% (8 Oct) | ₹5 first interim, payout about ₹1,955 crore | 14 Oct 2026 |
Long-Term Buys: Blue-Chip Stock Picks at Reasonable Valuations
Screening criteria: Nifty 50 leaders with structural growth drivers and P/E below 20 (blog’s own screen).
| Stock | CMP ₹ | Change % | Key Metric | Why It Qualifies |
|---|---|---|---|---|
| ICICI Bank | 1,355.00 | Nifty Bank up 1.36% | P/E 18.63; EPS ₹72.69 | Private bank compounding at moderate valuation |
| Larsen & Toubro | 3,703.30 | +2.17% (BSE) | Market cap ₹5,08,957.32 crore | Direct play on 11.9% GFCF growth |
| TCS | 2,156.00 | +3.85% | P/E 14.11; EPS ₹153.31 | AI revenue run-rate above $3.1 billion |
| Mahindra & Mahindra | 2,796.20 | Auto rebound | P/E 21.24; EPS ₹131.43 | Rural jobs improving (rural UR 4.1%) |
| State Bank of India | 959.10 | +2.03% | P/E 11.27; EPS ₹85.04 | Cheapest large bank on earnings |
High Earnings-Yield Blue Chips: Where Each Rupee Buys the Most Profit
Screening criteria: Nifty 50 stocks ranked by earnings yield (100 divided by P/E). A high earnings yield often goes with strong dividend capacity.
| Stock | CMP ₹ | Earnings Yield | P/E | Why It Qualifies |
|---|---|---|---|---|
| ONGC | 221.27 | 15.06% | 6.64 | Lowest P/E in the Nifty 50 |
| State Bank of India | 959.10 | 8.87% | 11.27 | Market cap ₹8,84,399.77 crore |
| Tata Steel | 173.80 | 8.29% | 12.06 | Cyclical value after metal sell-off |
| NTPC | 312.00 | 7.87% | 12.71 | Regulated utility cash flows |
| Coal India | 411.55 | 7.46% | 13.40 | Traditionally a high-payout PSU |
Fundamentally Strong and Low-Debt Leaders: Balance-Sheet Fortresses
Screening criteria: large companies widely recognised for net-cash or near debt-free balance sheets, shown with verified 9 October prices and P/E.
| Stock | CMP ₹ | Change % | Key Metric | Why It Qualifies |
|---|---|---|---|---|
| TCS | 2,156.00 | +3.85% | P/E 14.11 | Net-cash IT bellwether with steady payouts |
| Infosys | 1,023.40 | +2.65% | P/E 13.34 | Cash-rich, lowest P/E among IT majors |
| ITC | 266.00 | +4.31% | P/E 17.47 | Cash-generative FMCG and hotels |
| Bajaj Auto | 9,778.00 | Auto rebound | P/E 25.07; EPS ₹390.44 | Cash-rich two-wheeler leader |
| Maruti Suzuki | 11,420.00 | Auto rebound | P/E 25.52; EPS ₹446.54 | Large cash pile, market leader |
52-Week Low Watch and Friday’s Biggest A-Group Decliners
Screening criteria: stocks that fell the most in BSE’s ‘A’ group on 9 October (prices at 2:45 PM, Capital Market) despite a strongly positive market, a red flag for stock-specific weakness.
| Stock | Price ₹ | Change % | Key Metric | Why It Qualifies |
|---|---|---|---|---|
| Healthcare Global Enterprises | 590.95 | -7.49% | 40,160 shares vs 70,566 average | Biggest A-group loser on an up day |
| India Glycols | 332.85 | -6.93% | 72,372 shares vs 1.2 lakh average | Gave back part of its 7 Oct surge |
| Anand Rathi Wealth | 2,046.75 | -4.54% | 59,451 shares vs 18,456 average | Selling on 3 times normal volume |
| Aditya Vision | 579.70 | -3.97% | 4,948 shares vs 8,518 average | Weak despite market rally |
| Caplin Point Laboratories | 2,452.05 | -3.87% | Pharma small cap | Underperformed the pharma pack |
Sector Performance India 2026: Which Sectors Led and Which Lagged?
| Sectoral Index | Close / Move (9 Oct) | Key Constituent Moves | Latest Earnings Trend | Outlook |
|---|---|---|---|---|
| Nifty IT | 28,574.90 (+3.02%) | TCS +3.85%, HCL Tech +3.38%, Infosys +2.65% | TCS Q2: revenue +11.2%, profit about +15% | Positive; Infosys, HCL and Wipro results next |
| Nifty FMCG | +2.20% | ITC +4.31% | Rural unemployment at 4.1% supports demand | Defensive leader |
| Nifty Bank | 55,256.65 (+1.36%) | Federal Bank +2.80%, HDFC Bank +2.17%, SBI +2.03% | Margins face repo hike to 5.50% | Neutral to positive |
| Nifty Financial Services | 24,968.50 (+1.33%) | ICICI Lombard +4.08%, Cholamandalam +2.82% | Funding costs rising | Prefer insurers over NBFCs |
| Nifty Auto | Rebounded | Eicher +4.17%, Tata Motors PV +2.53% | Auto fell over 4% intraday on 1 Oct | Volatile, rate-sensitive |
| Nifty Metal | Lagged | JSW Steel -0.61% | Metal, realty and oil and gas led the 8 Oct decline | Cautious |
| Nifty Midcap 100 | +1.56% | Broad recovery | Fell over 2% on 8 Oct | Stock-specific |
IT is the clear leader of the stock market today, powered by a better-than-feared TCS quarter and a rupee near 96.73 that inflates rupee revenue. FMCG and banks provided breadth. Metals, realty and energy remain the laggards because crude above $100 and rising rates squeeze margins and demand.
Top 10 Gainers and Losers in the Nifty 50: Who Won Friday’s Rebound?
Change in rupees is calculated from the closing price and percentage change, so treat it as approximate.
| Stock | Close ₹ | Change ₹ | Change % | Reason for Move |
|---|---|---|---|---|
| Apollo Hospitals | 8,027.50 | +361.82 | +4.72% | Defensive healthcare buying |
| ITC | 266.00 | +10.99 | +4.31% | FMCG rotation, low P/E |
| Eicher Motors | 7,050.00 | +282.22 | +4.17% | Short covering in autos |
| TCS | 2,156.00 | +79.93 | +3.85% | Q2 FY27 beat and dividend |
| HCL Technologies | 1,216.70 | +39.78 | +3.38% | IT sector rally |
| Adani Ports | 1,761.00 | +52.95 | +3.10% | Easing crude, trade outlook |
| Infosys | 1,023.40 | +26.42 | +2.65% | Ahead of Q2 results |
| Tata Motors PV | 279.90 | +6.91 | +2.53% | Auto rebound |
| Shriram Finance | 940.45 | +23.21 | +2.53% | Financials rally |
| UltraTech Cement | 10,675.00 | +249.18 | +2.39% | Closed near day’s high; capex theme |
With 46 advances, only four Nifty 50 stocks closed lower on Friday, so the losers list below is complete.
| Stock | Close ₹ | Change ₹ | Change % | Reason for Move |
|---|---|---|---|---|
| BSE Ltd | 3,287.20 | -47.69 | -1.43% | Profit booking in capital-market stocks |
| Reliance Industries | 1,170.30 | -7.66 | -0.65% | Energy weakness as crude eased |
| JSW Steel | 1,168.00 | -7.17 | -0.61% | Metal sector pressure |
| Cipla | 1,301.00 | -5.75 | -0.44% | Pharma rotation into IT |
Stock Recommendations for Today: 6 Ideas With Entry, Target and Stop Loss
The trade levels below are this blog’s own analysis, built from verified 9 October closes with a fixed risk framework (stop loss about 4% to 5% below entry, target about 8% to 10% above). They are educational illustrations, not personalised advice.
TCS
- CMP: ₹2,156.00
- Trigger: Q2 FY27 profit up about 15%; ₹12 dividend with 14 October record date
- Entry range: ₹2,120 to ₹2,160
- Target: ₹2,350
- Stop loss: ₹2,060
- Time frame: 2 to 4 weeks
- Rationale: IT leads a beaten-down sector; P/E of 14.11 is undemanding after a roughly 35% fall in 2026
- Key risk: A weak US tech tape or soft guidance from peers
HDFC Bank
- CMP: ₹707.25
- Trigger: Largest contributor to Nifty Bank’s 1.36% rise
- Entry range: ₹695 to ₹710
- Target: ₹770
- Stop loss: ₹675
- Time frame: 3 to 6 weeks
- Rationale: P/E 14.42 with deposit strength in a rising-rate cycle
- Key risk: Continued FII selling in financials
State Bank of India
- CMP: ₹959.10
- Trigger: Up 2.03%; P/E 11.27
- Entry range: ₹945 to ₹960
- Target: ₹1,040
- Stop loss: ₹915
- Time frame: 3 to 6 weeks
- Rationale: Cheapest large bank; beneficiary of 7.8% GDP growth
- Key risk: Treasury losses if bond yields rise
ITC
- CMP: ₹266.00
- Trigger: Top Sensex gainer at +4.78% on BSE
- Entry range: ₹260 to ₹267
- Target: ₹290
- Stop loss: ₹252
- Time frame: 2 to 4 weeks
- Rationale: Defensive FMCG with momentum and P/E 17.47
- Key risk: Food inflation hitting input costs
Infosys
- CMP: ₹1,023.40
- Trigger: Lowest IT P/E at 13.34 ahead of Q2 results
- Entry range: ₹1,005 to ₹1,025
- Target: ₹1,110
- Stop loss: ₹975
- Time frame: 2 to 4 weeks
- Rationale: TCS beat raises the bar positively for peers
- Key risk: Results-day volatility
Portfolio Suggestions by Risk Appetite: Build Your 2026 Game Plan
Conservative Portfolio: Capital Protection First
| Stock | Allocation % | Sector | Recent Earnings Driver |
|---|---|---|---|
| HDFC Bank | 25% | Private Bank | P/E 14.42; EPS ₹49.02 |
| TCS | 20% | IT | Q2 profit up about 15%; ₹24 interim dividends in FY27 |
| ITC | 20% | FMCG | P/E 17.47; strong FMCG rotation |
| Power Grid | 15% | Utilities | P/E 14.80; regulated returns |
| NTPC | 20% | Power | P/E 12.71; earnings yield 7.87% |
- Pros: low valuations, steady cash flows, dividend support and lower volatility.
- Cons: limited upside in a sharp rally; utilities are sensitive to rising bond yields.
Moderate Portfolio: Balanced Growth and Value
| Stock | Allocation % | Sector | Recent Earnings Driver |
|---|---|---|---|
| ICICI Bank | 20% | Private Bank | P/E 18.63; EPS ₹72.69 |
| Infosys | 20% | IT | P/E 13.34; Q2 results due |
| Larsen & Toubro | 20% | Capital Goods | GFCF growth of 11.9% in Q1 FY27 |
| State Bank of India | 20% | PSU Bank | P/E 11.27; EPS ₹85.04 |
| Mahindra & Mahindra | 20% | Auto | P/E 21.24; rural demand |
- Pros: diversified exposure to the GDP and capex story at reasonable prices.
- Cons: banks and autos are vulnerable to further rate hikes in December.
Aggressive Portfolio: High Beta for High Conviction
| Stock | Allocation % | Sector | Recent Earnings Driver |
|---|---|---|---|
| Trent | 20% | Retail | Closed above three moving averages; P/E 74.24 |
| Eicher Motors | 20% | Auto | P/E 36.53; +4.17% Friday |
| Shriram Finance | 20% | NBFC | P/E 19.62; FinNifty leader |
| Adani Ports | 20% | Infrastructure | +3.10% Friday; market cap ₹4,05,496.80 crore |
| Tata Steel | 20% | Metals | P/E 12.06; cyclical recovery bet |
- Pros: highest upside if the bottoming process confirms and FIIs return.
- Cons: large drawdowns are likely if crude spikes again or Nifty breaks 22,200.
Final Thought: The Market Has Bounced, Now It Needs Proof
Key Takeaways
- Friday’s 1.30% Nifty rally snapped an eight-week losing streak, but the index still trades below key averages with daily RSI at 36.50.
- Unique insight 1: DIIs bought ₹24,908.95 crore in four October sessions against FII selling of ₹23,266.03 crore, a near perfect offset.
- Unique insight 2: the Sensex finished Friday just 0.01% below its September close, despite a 1,000-point fall on Thursday.
- Unique insight 3: only four Nifty 50 stocks fell on Friday, and Reliance was the sole Sensex decliner.
- India GDP growth of 7.8% is colliding with CPI inflation of 4.82% and a repo rate now at 5.50%.
- What to watch next: September CPI, Q2 results from Infosys and other IT peers, Brent crude near $103, and whether Nifty holds 22,480 and clears 22,635.
Monday’s session will test whether Friday was a turning point or a pause. Keep position sizes disciplined, respect the 22,200 support zone, and let price confirm the story before turning aggressive.
Frequently Asked Questions About the Stock Market Today
What is the Sensex and Nifty level today, 12 October 2026?
As of the latest close on Friday, 9 October 2026, the BSE Sensex stood at 72,472.33, up 1.23%, and the NSE Nifty 50 at 22,520.45, up 1.30%. GIFT Nifty traded around 22,645 early Monday, pointing to a positive start for the stock market today.
Why did the Indian stock market rise on Friday?
Markets rebounded on strong buying in IT stocks after TCS posted Q2 FY27 profit growth of about 15%, a pullback in Brent crude towards $103, softer bond yields and reports that the US would not attack Iran before 3 November. Breadth was strong, with 46 of 50 Nifty stocks rising.
What is the current RBI repo rate in October 2026?
The RBI’s Monetary Policy Committee raised the repo rate by 25 basis points to 5.50% on 7 October 2026, its first hike since February 2023. The stance moved to calibrated tightening, and the RBI now projects FY27 CPI inflation at 5.2% and GDP growth at 7.1%.
What is India’s latest CPI inflation rate?
Retail inflation for August 2026 was 4.82%, up from 4.45% in July, according to MoSPI. Food inflation rose to 5.95%. CPI data for September 2026 is scheduled for release on 12 October 2026, and ICRA expects food inflation to rise towards 7%.
What are the Nifty support and resistance levels for today?
Immediate support lies at 22,480 to 22,500, followed by 22,221.85 and the 22,200 zone. Resistance is at 22,580 to 22,635 and then 22,800 to 22,950. Our classic pivot calculation places the pivot at 22,465 with R1 at 22,636 and S1 at 22,350.
Are FIIs buying or selling Indian stocks in October 2026?
FIIs are heavy sellers. NSE provisional data shows net FII selling of ₹23,266.03 crore across 1, 5, 6 and 7 October, while DIIs bought ₹24,908.95 crore. NSDL data released on 9 October showed FIIs as net sellers of ₹12,884.07 crore in equities.
What is the TCS dividend record date?
TCS declared a second interim dividend of ₹12 per share for FY27 with a record date of 14 October 2026 and payment on 30 October. Under T+1 settlement, investors need to buy the shares by 13 October to be eligible for this payout.
Is it a good time to invest in Indian stocks now?
The Sensex trades just 1.65% above its 52-week low, so valuations look more reasonable than earlier in 2026. However, FII selling, crude near $103 and rising rates remain risks. Staggered buying in quality stocks suits long-term investors; consult a SEBI-registered adviser first.
Disclaimer: This content is for educational and informational purposes only and is not investment advice. Stock prices, trade levels and portfolio allocations mentioned are illustrations based on publicly available data and the author’s own analysis. Markets carry risk, and past performance does not guarantee future returns. Please consult a SEBI-registered investment adviser before making any investment decision.