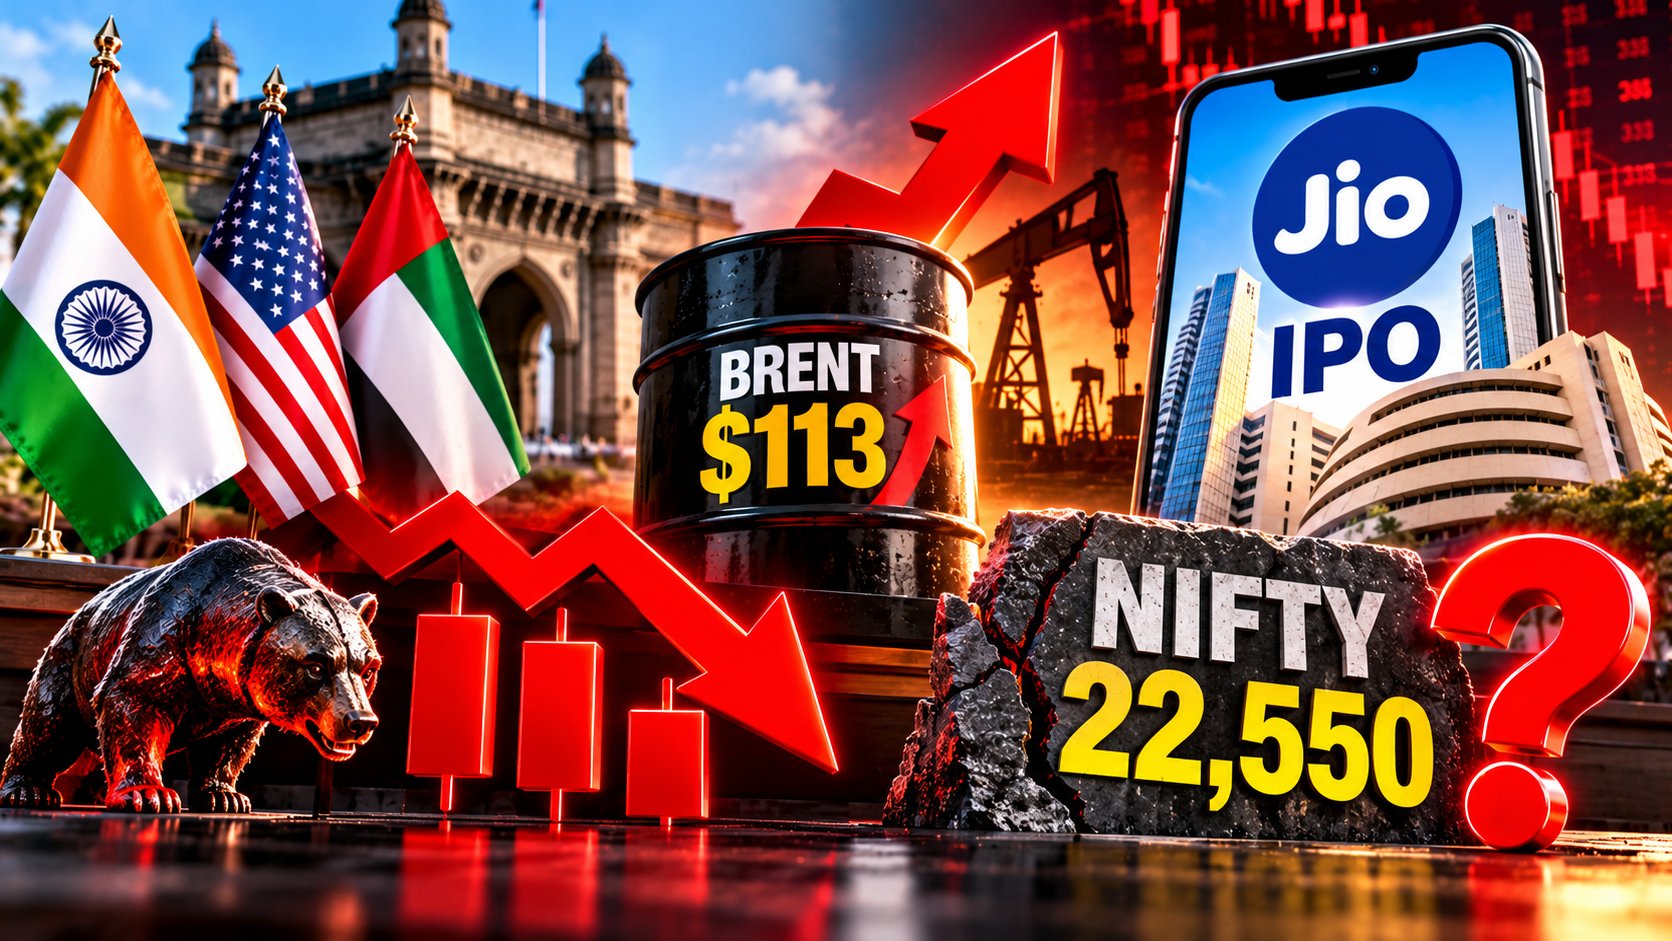
Three Red Days, Brent at $113 and Jio IPO Closing. Will Nifty Hold 22,550?
Three Red Days, Brent at $113 and Jio IPO Closing. Will Nifty Hold 22,550?
Dailyfinancial.in Market Desk | Friday, 23 October 2026 | Closing data as of market close, 22 October 2026, with pre-open cues for 23 October
Quick Summary: The Numbers That Matter (as of market close, 22 October 2026)
- BSE Sensex: 73,249.39, down 460.30 points (-0.62%), third straight fall
- NSE Nifty 50: 22,687.65, down 123.70 points (-0.54%) after touching 22,554.85
- Nifty Bank: 54,832.35, down 0.26%
- India VIX: 15.82, up 0.90%
- FII / DII (provisional): FIIs sold ₹3,458.70 crore, DIIs bought ₹2,891.32 crore
- Best sector: Nifty Pharma, the smallest decliner at -0.21%, while Media fell 2.34%
- 23 October cues: GIFT Nifty at 22,711 points to a flat open; Brent settled at $113.17
Brent crude jumped 4% to $113.17 a barrel on Thursday, 22 October 2026, after attacks on a Saudi Aramco oilfield. On the same day, the Nasdaq sank 2.60%, Hong Kong’s Hang Seng fell 3.03%, and India’s Nifty Midcap 100 slid to a six-month low.
Yet the Nifty 50 bounced 133 points off its intraday low of 22,554.85 to close at 22,687.65, almost exactly where it opened. Is that a sign of buyers defending the line, or just a pause in a three-day slide? This briefing on the stock market today, 23 October 2026, covers verified BSE Sensex, NSE Nifty 50 and Nifty Bank data, macro drivers, Nifty levels, global cues, 16 stock screens, sector performance India 2026, gainers and losers, stock ideas and model portfolios, as the record Jio Platforms IPO closes today.
Indian Market Overview: Why Has Dalal Street Fallen for Three Straight Sessions?
Oil is the common thread. Brent crossed $110 on 21 October and $112 on 22 October amid West Asia escalation, Business Standard reported, raising India’s import bill and inflation worries. Sunny Aggrawal, head of fundamental research at SBI Securities, said broader markets stayed under pressure on high crude prices and escalation concerns.
| Index / Metric | Close (22 Oct 2026) | Change | Change % | Session Detail |
|---|---|---|---|---|
| BSE Sensex | 73,249.39 | -460.30 | -0.62% | Intraday low 73,005.11 |
| NSE Nifty 50 | 22,687.65 | -123.70 | -0.54% | Range 22,554.85 to 22,785.00 |
| Nifty Bank | 54,832.35 | Fell | -0.26% | Outperformed the Nifty |
| India VIX | 15.82 | Rose | +0.90% | Highest reading this week |
| Nifty Midcap 100 | 57,063.95 | -501.90 | -0.87% | Six-month low, per CNBC-TV18 |
| Nifty Smallcap 100 | 18,275.90 | -211.40 | -1.14% | Weakest segment |
Breadth stayed weak. Within the Nifty 50, 14 stocks advanced and 36 declined, per Angel One, while across the market 1,323 stocks rose against 2,670 declines and 155 unchanged, according to IIFL Securities.
Institutional flows flipped again. FIIs sold ₹3,458.70 crore and DIIs bought ₹2,891.32 crore on 22 October, CNBC-TV18 reported from provisional data, a day after FIIs had turned net buyers of ₹1,022.32 crore.
V K Vijayakumar, chief investment strategist at Geojit Investments, warned that the broader market’s resilience has been driven more by liquidity than earnings, and that the valuation gap with large caps “cannot continue for long and will get corrected.” The steep slide in midcaps and small caps this week suggests that correction is already under way.
Key Economic Drivers: Can India’s Growth Engine Survive $113 Oil?
A sharp crude spike is testing India’s macro cushion just as inflation is already running hot. Here is how India GDP growth, CPI inflation, RBI repo rates and jobs data stack up as of 23 October 2026.
India GDP Growth: How Much Room Does 7.8% Growth Really Give?
India’s real GDP grew 7.8% in Q1 FY27 (April to June 2026), according to MoSPI, with real output at ₹81.36 lakh crore versus ₹75.46 lakh crore a year earlier. Manufacturing grew 9.2% and gross fixed capital formation 11.9%, while the RBI expects FY27 growth of 7.1%.
Q2 FY27 GDP data is due on 30 November 2026. Earnings so far, from ICICI Bank’s 20.1% profit growth to Indian Hotels’ raised revenue guidance, suggest the July to September quarter held up well.
What this means for markets: Solid growth supports domestic-facing large caps, which is why Bank Nifty fell only 0.26% on Thursday while oil-sensitive sectors fell more than 1%.
CPI Inflation Trend: Will Crude Push Prices Even Higher?
CPI inflation for September 2026 rose to 5.54% from 4.83% in August, with food inflation at 7.74%, per MoSPI. Wholesale inflation for September jumped to 11.39% from 9.92%, led by fuel, food and manufactured goods.
With Brent now above $113, fuel costs are likely to keep pressure on both indices. October CPI data will be released on 12 November 2026.
What this means for markets: Rising inflation expectations hurt consumer staples, which explains FMCG’s 1.74% fall on Thursday, the second-worst sector after media.
RBI Repo Rate: Could Oil Force Another Hike?
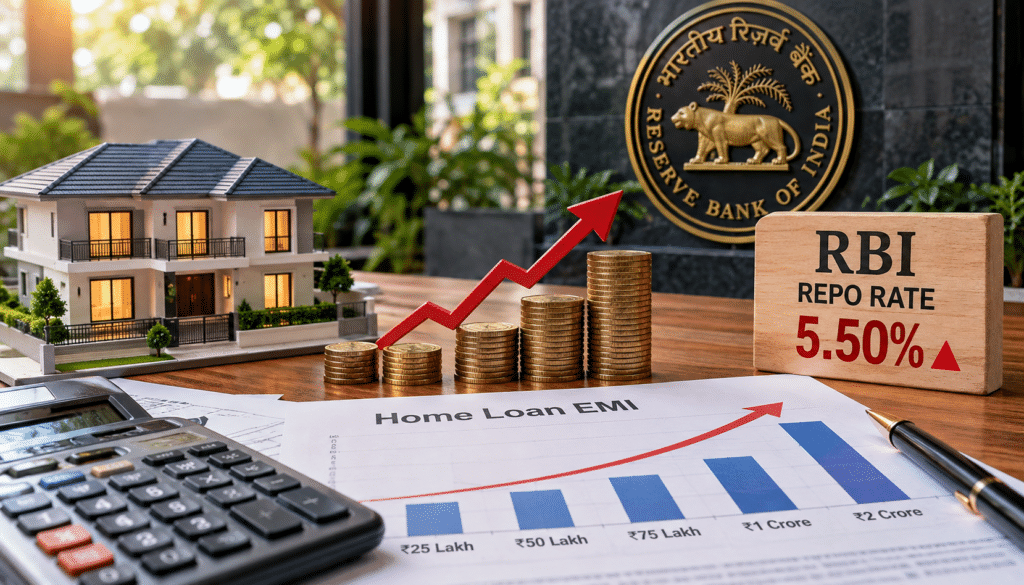
The RBI raised the repo rate by 25 basis points to 5.50% at its 5 to 7 October 2026 meeting, its first hike since February 2023, and adopted a stance of calibrated tightening. The Standing Deposit Facility is at 5.25%, and the MSF and Bank Rate are at 5.75%.
With CPI at 5.54%, the real policy rate is slightly negative. A sustained move in crude above $110 raises the odds that the MPC tightens again at its next review.
What this means for markets: Rate-sensitive sectors such as NBFCs and realty remain vulnerable, though Bajaj Finance’s 1.74% rebound on Thursday shows buyers are picking selectively.
PLFS Unemployment: Is the Jobs Market Losing Momentum?
The PLFS bulletin for September 2026 showed India’s unemployment rate steady at 5.0%. Rural unemployment rose to 4.2% from 4.1% and urban unemployment to 6.9% from 6.8%, while labour force participation slipped to 55.5%.
On the positive side, urban female participation climbed to 25.9%, and the urban worker population ratio of 47.2% was the highest since October 2025, DD India reported.
What this means for markets: A flat jobs market combined with rising prices squeezes household budgets, a headwind for discretionary consumption stocks in the festive season.
Nifty Today: Did Thursday’s Long Lower Shadow Mark a Short-Term Floor?
The Nifty ended almost exactly where it started, after a sharp dip and recovery. Here is the point-by-point breakdown, as of market close, 22 October 2026, with cues for 23 October.
- Open: 22,687.75, below the previous close of 22,811.35.
- High: 22,785.00, capped below the 23,000 call wall.
- Low: 22,554.85, a 1.12% intraday fall.
- Close: 22,687.65, down 123.70 points or 0.54%, just 0.10 points below the open.
- Distance from 2026 low: About 2.3% above the 8 October intraday low of 22,179.90.
- Support levels: 22,555 (Thursday’s low), then 22,200 to 22,400 (Ajit Mishra, Religare Broking).
- Resistance levels: 22,785 (Thursday’s high), then 22,900 (Religare Broking).
- Classic pivot for 23 October: Pivot 22,675.83, R1 22,796.82, R2 22,905.98, S1 22,566.67, S2 22,445.68 (blog’s calculation from the 22 October high, low and close).
- Put-Call Ratio: 0.70 at 4:45 pm on 21 October for the 27 October expiry (Quantsapp), down from 0.88 on 19 October, showing call writers in control.
- Maximum Call OI: 23,000 strike with 1.63 crore contracts; Maximum Put OI: 22,000 strike with 96.8 lakh contracts (Quantsapp, 21 October). Max pain stood at 22,900.
- Candlestick pattern: A doji with a long lower shadow, in which open and close were virtually identical after a 230-point intraday dip, signalling indecision with buying interest near 22,555.
- Trend verdict: Short-term bearish but stabilising. CNBC-TV18 noted the Nifty closed below its 20-day moving average.
- Outlook for the next session: GIFT Nifty at 22,711 suggests a flat start near the pivot of 22,676. A close above 22,797 would signal a rebound, while a break below 22,555 opens 22,400.
BSE Sensex vs Nifty 50 Trend in October 2026: How Much of the Monthly Gain Is Left?
September 2026 has closed, so this table covers every October session so far against the 30 September closes of 72,480.29 for the Sensex and 22,620.45 for the Nifty.
| Date | Sensex Close | Sensex Day % | Sensex MTD % | Nifty 50 Close | Nifty Day % | Nifty MTD % |
|---|---|---|---|---|---|---|
| 30 Sep (base) | 72,480.29 | Base | 0.00% | 22,620.45 | Base | 0.00% |
| 1 Oct | 71,909.70 | -0.79% | -0.79% | 22,421.95 | -0.88% | -0.88% |
| 2 Oct: Market holiday for Gandhi Jayanti | ||||||
| 5 Oct | 72,382.47 | +0.66% | -0.13% | 22,555.75 | +0.60% | -0.29% |
| 6 Oct | 73,067.81 | +0.95% | +0.81% | 22,776.10 | +0.98% | +0.69% |
| 7 Oct | 72,638.71 | -0.59% | +0.22% | 22,602.55 | -0.76% | -0.08% |
| 8 Oct | 71,593.24 | -1.44% | -1.22% | 22,231.80 | -1.64% | -1.72% |
| 9 Oct | 72,472.33 | +1.23% | -0.01% | 22,520.45 | +1.30% | -0.44% |
| 12 Oct | 71,924.68 | -0.76% | -0.77% | 22,363.35 | -0.70% | -1.14% |
| 13 Oct | 73,033.78 | +1.54% | +0.76% | 22,721.95 | +1.60% | +0.45% |
| 14 Oct | 72,781.89 | -0.34% | +0.42% | 22,622.70 | -0.44% | +0.01% |
| 15 Oct | 74,315.61 | +2.11% | +2.53% | 22,997.35 | +1.66% | +1.67% |
| 16 Oct | 74,729.27 | +0.56% | +3.10% | 23,146.15 | +0.65% | +2.32% |
| 19 Oct | 73,852.90 | -1.17% | +1.89% | 22,888.95 | -1.11% | +1.19% |
| 20 Oct: Market holiday for Dussehra | ||||||
| 21 Oct | 73,709.69 | -0.19% | +1.70% | 22,811.35 | -0.34% | +0.84% |
| 22 Oct | 73,249.39 | -0.62% | +1.06% | 22,687.65 | -0.54% | +0.30% |
Both indices remain in the green for October, but barely: the Sensex is up 1.06% and the Nifty just 0.30%. Since peaking on 16 October, both have fallen 1.98%, giving back most of the month’s gains in three sessions.
The Sensex keeps outperforming because heavyweights such as ICICI Bank, Bajaj Finance and the IT majors have held up better than the broad market. The blog’s view is that a Nifty close below 22,620, the September-end level, would turn October negative and shift sentiment decisively bearish.
Latest Market News Highlights: Which 8 Stories Will Move Markets on Friday?
From oilfields to the IPO market, here are the developments shaping the latest market news for 23 October 2026, with their immediate impact and the stocks affected.
- Saudi oilfield attack lifts Brent to $113. Brent settled 4% higher at $113.17 on 22 October after attacks on a Saudi Aramco oilfield, while WTI rose to $99.47. Impact: Reliance fell 2.03%, HPCL 1.9% and IndiGo 0.9%; oil marketing, aviation and paint stocks remain under pressure.
- Jio Platforms IPO closes today. The ₹30,213 crore issue, priced at ₹1,065 to ₹1,119, was subscribed 4.38 times by 3 pm on day 2, HDFC Sky reported, with QIBs at 9.78 times by early afternoon per Business Standard. Listing is likely on 28 October. Impact: liquidity diverted from secondary markets.
- FSSAI notices hit Nestle and Zydus Wellness. The food regulator issued notices over claims on Nestle’s Lactogen Pro 1 and Nan Excella Pro Stage 1, Upstox reported. Nestle fell 2.78% to ₹1,189.90, its fresh slide since results, and Zydus Wellness dropped 3.4%.
- Indian Hotels raises guidance. IHCL lifted its FY27 consolidated revenue growth guidance to 15% to 17% from 12% to 14%, and Q2 profit rose 22.7% to ₹349.49 crore. Impact: the stock rose 3.89%, a rare large-cap gainer.
- Midcaps slump to a six-month low. The Nifty Midcap 100 fell 0.87% to 57,063.95, with KEI Industries down 8.45%, Swiggy 5.48% and Kalyan Jewellers 4.78%, per Upstox. Impact: confirms the valuation correction Geojit’s V K Vijayakumar flagged.
- eMudhra crashes on certificate advisory. The cybersecurity firm fell 20% on 22 October, and 36% over two sessions, after a CERT-In advisory on compromised intermediate digital certificates, HDFC Sky reported.
- India-US trade deal hopes. US Secretary of State Marco Rubio said a deal could come “within weeks rather than months,” HDFC Sky reported, which briefly lifted markets on 21 October before oil erased the gains. Impact: export sectors such as IT and textiles stay in focus.
- Infosys results today. Infosys reports Q2 FY27 numbers on 23 October after gaining 3.30% to ₹1,168 on 21 October and then easing 1.25% on 22 October. Impact: IT index direction for next week.
Global Cues: Can India Withstand a 2.6% Nasdaq Rout and 3% Asian Slide?
Thursday was one of the roughest days for global equities this month, driven by AI-spending worries in tech and the oil spike. Yet US bond yields fell sharply, which offers some relief.
| Index | Last Close | Change % | Date / Timing |
|---|---|---|---|
| Dow Jones | 52,867.98 | +0.02% | 22 Oct 2026 close |
| S&P 500 | 7,663.43 | -1.21% | 22 Oct 2026 close |
| Nasdaq Composite | 26,008.86 | -2.60% | 22 Oct 2026 close |
| GIFT Nifty | 22,711.00 | Down 37 points | Late 22 Oct trade; points to flat 23 Oct open |
| Nikkei 225 | 62,907.84 | -2.65% | 22 Oct 2026 close |
| Hang Seng | 22,934.68 | -3.03% | 22 Oct 2026 close |
| Shanghai Composite | 3,658.03 | -1.48% | 22 Oct 2026 close |
| KOSPI | 5,533.77 | -3.52% | 22 Oct 2026 close |
| FTSE 100 | 10,725.03 | -0.26% | 22 Oct 2026 close |
| DAX | 25,371.75 | -1.07% | 22 Oct 2026 close |
| CAC 40 | 7,811.26 | -1.39% | 22 Oct 2026 close |
| Macro Indicator | Level | Move | Reference Time |
|---|---|---|---|
| US Dollar Index (DXY) | 101.65 | -0.13% | 22 Oct 2026 close |
| US 10-Year Treasury Yield | 4.96% | Down 17 bp | 22 Oct 2026 close |
| Brent Crude | $113.17 | +4.00% | 22 Oct 2026 settlement |
| Gold (December futures) | About $4,038 per ounce | -2.7% | 22 Oct 2026 |
| USD/INR | About 94.8 | Rupee weaker after eight gaining sessions | 22 Oct 2026 |
How each cue influenced Indian markets:
- Nasdaq sell-off: The 2.60% drop, its sharpest in months as AI-spending worries hit tech, weighed on Indian IT, which fell 1.31% after a 2.88% rally the day before.
- US Treasury yields: A 17 basis point plunge to 4.96% is the biggest positive cue, widening the India-US gap to about 2.4 percentage points against India’s 10-year yield near 7.40%, which could slow FII selling.
- Asian rout: Falls of 3.03% in Hong Kong, 3.52% in Korea and 2.65% in Japan reflected oil and Iran-conflict fears, spilling into Indian midcaps.
- Europe: Losses of more than 1% in the DAX and CAC showed the oil shock is global, not just Asian.
- Brent crude: At $113.17, oil is the single largest threat to India’s inflation, current account and corporate margins, especially for OMCs, airlines and paints.
- Dollar and rupee: A slightly weaker dollar at 101.65 did not stop the rupee from slipping to about 94.8, ending an eight-session winning run, Upstox reported.
- Gold: Gold’s 2.7% fall alongside lower yields suggests investors raised cash across assets, a sign of broad de-risking.
- Dow resilience: The Dow’s flat close shows non-tech value stocks are holding up, mirroring India’s relative strength in banks and pharma.
Performance Overview: Which Top NSE/BSE Stocks Survived the Sell-Off and Made Our 16 Screens?
Each screen uses verified prices and metrics with a stated date. Where exchanges do not publish an indicator, such as RSI, we use and disclose a verifiable substitute so every column carries real data.
Daily Fresh Breakouts: Which Stocks Rose Against the Tide on 22 October?
Screening criteria: Stocks that rose sharply on 22 October on results, orders or heavy volume. Prices are from Multibagg’s intraday snapshot at about 2:35 pm unless stated.
| Stock | CMP ₹ (22 Oct) | Change % | Key Metric | Why It Qualifies |
|---|---|---|---|---|
| Beta Drugs | 1,971.00 | +18.40% | Q2 profit +51.8% to ₹18.55 crore | Results-led surge |
| Omnitech Engineering | 675.00 | +13.69% | Fresh aerospace and defence orders | Order-led breakout |
| Vans Electroengineerings | 401.50 | +10.00% | Matched 52-week high | Momentum breakout |
| Indian Hotels | 783.30 | +3.89% at close | Q2 PAT +22.7%, guidance raised | Large-cap results winner |
| Balkrishna Industries | 2,108.55 | +3.43% | Volume 7.66 lakh shares | Steady accumulation |
Weekly Breakouts: Who Held Gains While the Market Fell 2% This Week?
Screening criteria: Stocks with gains over recent multi-session windows (stated in each row) during a week in which the Nifty fell 1.98% from its 16 October close, calculated by the blog from exchange prices.
| Stock | CMP ₹ | Change % (period) | Key Metric | Why It Qualifies |
|---|---|---|---|---|
| HCLTech | 1,424.20 (21 Oct) | +4.7% (15 to 21 Oct) | Q2 PAT +21.2% | IT leadership |
| Infosys | 1,168.00 (21 Oct) | +3.3% (19 to 21 Oct) | Results on 23 Oct | Pre-results buying |
| UltraTech Cement | 10,958.00 (22 Oct) | +2.9% (19 to 22 Oct) | PAT +21.29% | Recovered post-results dip |
| TCS | 2,529.00 (21 Oct) | +2.6% (16 to 21 Oct) | Operating margin 24% | Extended IT rally |
| Tech Mahindra | 1,834.70 (21 Oct) | +2.5% (16 to 21 Oct) | ₹15 dividend, record date 23 Oct | Results momentum |
Oversold Stocks: Which Names Look Stretched After the Slide?
Screening criteria: RSI is proprietary to charting platforms, so this screen uses verifiable proxies: falls of more than 5% in a session or multi-session declines, conditions that typically push RSI toward oversold levels.
| Stock | CMP ₹ | Change % | Key Metric | Why It Qualifies |
|---|---|---|---|---|
| Nestle India | 1,189.90 (22 Oct) | -2.78% | Down 6.7% since 15 Oct | FSSAI notice after weak reaction to results |
| Eternal | 304.45 (22 Oct) | -2.53% | Down 4.9% in two sessions | Post-results selling |
| HDFC Life | 528.35 (22 Oct) | -2.09% | Insurer selling | Repeated Nifty loser this month |
| Tata Motors PV | 278.00 (19 Oct) | -2.07% on 22 Oct | Fresh 52-week low on 22 Oct | Persistent auto weakness |
| Maruti Suzuki | 11,200.00 (21 Oct) | -2.40% on 21 Oct | Fresh 52-week low on 22 Oct | Passenger vehicle slowdown |
Outside the Nifty, the sharpest falls came in eMudhra (-20% on 22 October and -36% over two sessions), KEI Industries (-8.45%) and Swiggy (-5.48%), per HDFC Sky and Upstox, making them candidates to watch for a technical bounce.
Stocks Nearing Breakout: Who Is Closest to a Big Level?
Screening criteria: Stocks within 8% of their 52-week high or a major round number, with the gap calculated by the blog.
| Stock | CMP ₹ | Change % | Key Metric | Why It Qualifies |
|---|---|---|---|---|
| Indian Hotels | 783.30 (22 Oct, 2:35 pm) | +3.89% | 1.44% below 52-week high of ₹794.75 | Guidance upgrade |
| Bharti Airtel | 1,891.70 (21 Oct) | +0.88% | 0.44% below ₹1,900 | Gainer on 22 Oct too, per IIFL |
| UltraTech Cement | 10,958.00 (22 Oct) | +1.00% | 0.38% below ₹11,000 | Cement demand |
| HCLTech | 1,424.20 (21 Oct) | +3.21% | 1.81% below ₹1,450 | Earnings-led rally |
| Zydus Lifesciences | 1,135.00 (22 Oct, 2:35 pm) | +1.58% | 7.87% below 52-week high of ₹1,232 | Defensive pharma |
Short-Term Buys: Which Setups Fit a 2 to 4 Week Window?
Screening criteria: Blog’s own analysis: relative strength during the three-day fall, a clear catalyst and a definable stop loss.
| Stock | CMP ₹ | Change % | Key Metric | Why It Qualifies |
|---|---|---|---|---|
| Bajaj Finance | 942.10 (22 Oct) | +1.74% | Top Nifty gainer | Rebound from ₹926 |
| Cipla | 1,330.90 (22 Oct) | +1.29% | Pharma held up best | Defensive strength |
| UltraTech Cement | 10,958.00 (22 Oct) | +1.00% | PAT +21.29% | Infrastructure demand |
| Bharti Airtel | 1,891.70 (21 Oct) | +0.88% | Near ₹1,900 | Telecom rerating |
| HCLTech | 1,424.20 (21 Oct) | +3.21% | Q2 PAT +21.2% | IT earnings strength |
FII Holding Changes: Where Has Foreign Money Been Building Stakes?
Screening criteria: Companies with rising FII shareholding through the September 2026 quarter, per Equitymaster’s 8 October review. Stake columns replace price because the stake change is the signal.
| Stock | FII Stake Before | FII Stake Now | Key Earnings Metric | Why It Qualifies |
|---|---|---|---|---|
| Capri Global Capital | 8.21% | 13.00% | AUM +62% to ₹401.1 bn; PAT doubled | NIM 9.7%, RoAE about 19% |
| Groww (Billionbrains) | 6.89% | 10.90% | Latest PAT ₹725 crore, +54% | Mutual funds also raised stake |
| Shilpa Medicare | 10.92% | 12.11% | Q1 FY27 revenue +43% | EBITDA margin about 30% |
| Shyam Metalics | 2.97% | 5.29% | Q1 EBITDA +32% | Capex from internal accruals |
| D-Link India | 1.11% | 1.43% | Q1 revenue +30.5% | Debt-free, ROE about 20% |
DII Holding Changes: How Much Have Domestic Institutions Absorbed?
Screening criteria: Stock-level DII filings for September 2026 are still arriving, so this table tracks verified daily DII flows from provisional data (Quantsapp to 19 October; CNBC-TV18 for 21 and 22 October).
| Session | DII Net (₹ crore) | FII Net (₹ crore) | Combined (₹ crore) | What It Shows |
|---|---|---|---|---|
| 16 Oct | -3,661 | +1,166 | -2,495 | Rare FII buying day |
| 19 Oct | +3,201 | -1,149 | +2,052 | DIIs bought the bank sell-off |
| 21 Oct | +1,614.32 | +1,022.32 | +2,636.64 | Both bought on trade-deal hopes |
| 22 Oct | +2,891.32 | -3,458.70 | -567.38 | Oil shock revived FII selling |
| October MTD | About +55,875 | About -52,354 | About +3,520 | DIIs still ahead for the month |
October has now produced two FII buying days, 16 and 21 October, but both were followed by fresh selling. DIIs have absorbed about ₹55,875 crore of supply this month.
Upcoming Dividends: Which Record Dates Fall in the Next Few Days?
Screening criteria: Declared dividends with record dates from 23 to 27 October 2026, per the Anand Rathi dividend tracker. Under T+1 settlement, the ex-date equals the record date.
| Stock | Dividend per Share | Record / Ex-Date | Type | Why It Matters |
|---|---|---|---|---|
| Tech Mahindra | ₹15.00 | 23 October 2026 | Interim | Q2 PAT ₹1,586 crore |
| IRFC | ₹1.15 | 23 October 2026 | Interim | Q2 PAT +10.21% |
| ICICI Lombard | ₹7.00 | 23 October 2026 | Interim | General insurance leader |
| 360 ONE WAM | ₹7.50 | 23 October 2026 | Interim | Wealth manager; stock rose 1.56% on 22 Oct |
| HDB Financial Services | ₹2.00 | 23 October 2026 | Interim | HDFC Bank’s NBFC arm |
| L&T Technology Services | ₹20.00 | 27 October 2026 | Interim | Engineering services payout |
Long-Term Buys: Which Blue-Chip Stock Picks Can Ride Out the Oil Shock?
Screening criteria: Blog’s own analysis: market leadership, strong return ratios, visible earnings growth and limited direct exposure to crude prices.
| Stock | CMP ₹ | Change % | Key Metric | Why It Qualifies |
|---|---|---|---|---|
| TCS | 2,529.00 (21 Oct) | +2.77% (21 Oct) | Operating margin 24% | Oil-light, AI-led growth |
| UltraTech Cement | 10,958.00 (22 Oct) | +1.00% | PAT +21.29%, revenue +18.81% | Capex cycle |
| Cipla | 1,330.90 (22 Oct) | +1.29% | Defensive pharma | Low crude sensitivity |
| HCLTech | 1,424.20 (21 Oct) | +3.21% (21 Oct) | ROE 22.98%, D/E 0.07 | Strong cash returns |
| Bharti Airtel | 1,891.70 (21 Oct) | +0.88% (21 Oct) | Telecom pricing power | Jio IPO benchmarks valuations |
High Dividend Yield Stocks: Where Can Income Investors Earn 4% to 6%?
Screening criteria: Highest yields among quality companies with ROE above 20%, per Angel One screener data as of 28 September 2026.
| Stock | Dividend Yield | ROE | P/E and Debt-to-Equity | Why It Qualifies |
|---|---|---|---|---|
| Coal India | 6.27% | 27.83% | P/E 8.37, D/E 0.12 | Cash-generative PSU |
| Indian Oil | 6.19% | 20.21% | P/E 4.47, D/E 0.58 | Rose 1% on 22 Oct despite oil spike |
| BPCL | 5.70% | 28.47% | P/E 5.07, D/E 0.54 | High-ROE oil marketer |
| Infosys | 4.78% | 31.07% | P/E 13.80, D/E 0.10 | Near-5% yield in IT |
| NMDC | 4.52% | 23.36% | D/E 0.19, net margin 22.20% | Iron ore leader |
Fundamentally Strong Stocks: Which Balance Sheets Can Absorb Higher Costs?
Screening criteria: ROE above 20%, debt-to-equity at or below 0.12 and recent profit growth, per Angel One and company filings (September to October 2026).
| Stock | CMP ₹ / Reference | ROE | Key Metric | Why It Qualifies |
|---|---|---|---|---|
| TCS | 2,529.00 (21 Oct) | Top-tier IT | Q2 PAT +14.9% | Margin 24% |
| HCLTech | 1,424.20 (21 Oct) | 22.98% | Q2 PAT +21.2% | D/E 0.07 |
| BSE Ltd | 3,248.30 (21 Oct) | 43.92% | ROCE 41.43% | Debt-free exchange |
| Coal India | Market cap ₹2,60,375.27 crore | 27.83% | P/E 8.37 | Yield 6.27% |
| P&G Hygiene | Market cap ₹22,360.58 crore | 114.93% | D/E 0 | Exceptional capital efficiency |
Low Debt Mid Caps: Which Mid-Sized Firms Can Weather a Midcap Correction?
Screening criteria: Market capitalisation roughly ₹20,000 crore to ₹65,000 crore with debt-to-equity at or below 0.04 (Sahi screener, 5 August 2026; Angel One, 28 September 2026), plus Shyam Metalics for internally funded growth.
| Stock | Market Cap (₹ crore) | Debt-to-Equity | Return Ratio | Why It Qualifies |
|---|---|---|---|---|
| Schaeffler India | 63,886 | 0.01 | ROCE 27.3% | Bearings leader |
| Godfrey Phillips | 36,768 | 0.04 | ROCE 30.2% | High returns, minimal leverage |
| Shyam Metalics | About 29,220 | Capex from internal accruals | Q1 EBITDA margin 14% | Expansion without heavy debt |
| P&G Hygiene | 22,360.58 | 0.00 | ROE 114.93% | Zero-debt consumer brand |
| Tenneco Clean Air India | 20,266.99 | 0.04 | ROE 42.92%, yield 5.11% | High-yield auto ancillary |
Cash-Rich Small Caps: Which Smaller Names Carry Clean Balance Sheets?
Screening criteria: Small caps described as debt-free or virtually debt-free by Angel One (29 September 2026), Equitymaster (8 October 2026) or recent reports, with the latest verified price.
| Stock | Price Reference | Debt Status | Return Ratio / Metric | Why It Qualifies |
|---|---|---|---|---|
| PC Jeweller | ₹18.14 (19 Oct) | Debt-free after repaying bank dues, per reports | ₹73.6 crore block deal | Balance sheet turnaround |
| One Global Service Provider | ₹440.00 (19 Oct) | Virtually debt-free | ROE 65.27%, ROCE 65.7% | Volatile after lower circuit |
| Aayush Art and Bullion | ₹1,303 (29 Sep) | Debt-free | ROE 13.92% | Market cap ₹1,995.18 crore |
| D-Link India | P/E about 14 | Debt-free | ROE about 20% | Revenue +30.5%, FII stake rising |
Volume Shockers: Where Did Unusual Trading Flare Up on 22 October?
Screening criteria: Stocks with exceptional traded volumes on 22 October relative to their usual activity, per Multibagg’s intraday data as of about 2:35 pm.
| Stock | CMP ₹ (22 Oct, 2:35 pm) | Change % | Key Metric | Why It Qualifies |
|---|---|---|---|---|
| Tata Teleservices (Maharashtra) | 38.25 | +19.23% | 21.54 crore shares | Near upper circuit with MTNL |
| Indian Hotels | 783.30 | +4.16% | 2.38 crore shares | Guidance upgrade |
| MTNL | 24.55 | +10.89% | 2.28 crore shares | Telecom small-cap frenzy |
| Omnitech Engineering | 675.00 | +13.69% | 2.26 crore shares | Defence orders |
| Bajaj Finance | 939.95 | +1.61% | 1.10 crore shares | Heaviest large-cap financial volume |
52-Week Highs: Which Stocks Are Hitting Yearly Peaks Despite the Sell-Off?
Screening criteria: Stocks that matched or traded within 8% of their 52-week high on 22 October, per Multibagg; gaps calculated by the blog. Only three verified names qualified on a heavily red day.
| Stock | 52-Week High ₹ | Price ₹ (22 Oct) | Gap to High | Why It Qualifies |
|---|---|---|---|---|
| Vans Electroengineerings | 401.50 | 401.50 (+10.00%) | 0.00% | Matched its yearly high |
| Indian Hotels | 794.75 | 783.30 (+4.16%, 2:35 pm) | 1.44% | Revenue guidance raised to 15% to 17% |
| Zydus Lifesciences | 1,232.00 | 1,135.00 (+1.58%) | 7.87% | Defensive pharma bid |
52-Week Lows: Which Big Names Hit Fresh Yearly Lows on 22 October?
Screening criteria: Stocks that touched a 52-week low on 22 October, as reported by Business Standard, with each stock’s latest verified closing price and date. Lupin and SRF also touched yearly lows, with SRF recovering to close about 1% higher, per CNBC-TV18.
| Stock | 52-Week Low Hit On | Latest Verified Close ₹ | Recent Move | Why It Is on the Watch List |
|---|---|---|---|---|
| Tata Motors PV | 22 October 2026 | 278.00 (19 Oct) | -2.07% on 22 Oct | Auto demand and margin pressure |
| Maruti Suzuki | 22 October 2026 | 11,200.00 (21 Oct) | -2.40% on 21 Oct | Passenger vehicle slowdown |
| NTPC | 22 October 2026 | 309.00 (19 Oct) | -1.95% on 19 Oct | Power stocks led 22 Oct declines |
Sector Performance India 2026: Why Did Pharma and Banks Hold While Media and FMCG Crashed?
Thirteen of sixteen sectoral indices fell on Thursday, HDFC Sky reported. The table shows closing levels and moves for 22 October, according to IIFL Securities, with 21 October moves where verified.
| Sectoral Index | Close (22 Oct) | 22 Oct Change | 21 Oct Move | Earnings / Driver | Outlook |
|---|---|---|---|---|---|
| Nifty Pharma | 25,511.30 | -0.21% | Fell 1% to 2% | Cipla +1.29%, Aurobindo +2.03% | Defensive positive |
| Nifty Bank | 54,832.35 | -0.26% | About -0.92% | ICICI Bank +0.97%, HDFC Bank -1.82% | Neutral |
| Nifty Financial Services | 24,624.30 | -0.27% | Bajaj Finance -3.27% | Bajaj Finance +1.74% rebound | Neutral |
| Nifty Metal | 11,763.65 | -0.81% | Fell 1% to 2% | Global growth worries | Cautious |
| Nifty Auto | 24,986.85 | -0.83% | Fell 1% to 2% | Tata Motors PV, Maruti at yearly lows | Weak |
| Nifty Consumer Durables | 34,853.75 | -0.91% | Fell 1% to 2% | Kalyan Jewellers -4.78% | Cautious |
| Nifty Energy | 35,080.90 | -1.11% | Fell 1% to 2% | Reliance -2.03%, HPCL -1.9% | Weak while oil rises |
| Nifty IT | 31,996.80 | -1.31% | +2.88% | Nasdaq -2.60%; Infosys results today | Positive medium term |
| Nifty FMCG | 42,962.00 | -1.74% | ITC +0.46% | Nestle FSSAI notice | Weak near term |
| Nifty Media | 1,584.75 | -2.34% | Fell 1% to 2% | Ad spend concerns | Weak |
Pharma, banks and financials led on a relative basis, falling less than 0.3% each as investors sought defensive and domestic-demand plays. Media, FMCG and IT were the laggards, the first two hurt by inflation and regulatory worries, the third by a Nasdaq sell-off.
The blog’s view is that oil-light sectors, namely pharma, private banks and IT, deserve an overweight until Brent cools below $105. Energy, auto and consumer stocks face the heaviest cost pressure.
Top 10 Gainers and Top 10 Losers: Who Led and Who Lagged the Nifty 50?
Only 14 Nifty 50 stocks advanced on 22 October. The tables include stocks with verified closing prices from Angel One, or prices derived from verified 21 October closes and published percentage moves (marked about).
| Rank | Stock | Close ₹ | Change ₹ | Change % | Reason for Move |
|---|---|---|---|---|---|
| 1 | Bajaj Finance | 942.10 | +16.10 | +1.74% | Rebound after 3.27% fall on 21 Oct |
| 2 | Cipla | 1,330.90 | About +16.95 | +1.29% | Defensive pharma buying |
| 3 | UltraTech Cement | 10,958.00 | +109.00 | +1.00% | Post-results strength |
| 4 | Bajaj Auto | About 10,155 | About +82.60 | +0.82% | Relative strength in autos |
ICICI Bank (+0.97%) and Bharti Airtel also ranked among the top gainers, per Upstox and IIFL Securities, but their exact closing prices were not included in those reports.
| Rank | Stock | Close ₹ | Change ₹ | Change % | Reason for Move |
|---|---|---|---|---|---|
| 1 | Nestle India | 1,189.90 | About -34.00 | -2.78% | FSSAI notice on product claims |
| 2 | Eternal | 304.45 | -7.90 | -2.53% | Post-results selling |
| 3 | HDFC Life | 528.35 | About -11.30 | -2.09% | Insurers sold |
| 4 | Reliance Industries | About 1,184.50 | About -24.50 | -2.03% | Oil spike hits refining sentiment |
| 5 | Infosys | About 1,153.40 | About -14.60 | -1.25% | Profit booking before results |
Tata Motors PV (-2.07%), HDFC Bank (-1.82%) and Coal India were also among the biggest Nifty losers, per Upstox and IIFL Securities. In all, 36 Nifty 50 stocks closed lower.
Stock Recommendations for Today: Which 6 Setups Look Strongest Amid the Oil Shock?
These are the blog’s own technical and fundamental ideas based on the latest verified closing prices, dated in each case. With crude at $113, focus is on oil-light, earnings-backed names.
Bajaj Finance: Is the Rebound From ₹926 the Start of a Bigger Recovery?
- CMP: ₹942.10 (22 Oct)
- Trigger: Top Nifty gainer, bouncing from ₹926
- Entry range: ₹930 to ₹945
- Target: ₹1,000 (about 7.0% upside from ₹935)
- Stop loss: ₹905 (about 3.2% risk)
- Time frame: 2 to 4 weeks
- Rationale: Relative strength in financials during a three-day fall
- Key risk: Higher funding costs if the RBI tightens again
Cipla: Can Defensive Pharma Keep Outperforming?
- CMP: ₹1,330.90 (22 Oct)
- Trigger: Gained on a 36-decliner day
- Entry range: ₹1,315 to ₹1,335
- Target: ₹1,405 (about 6.4% upside from ₹1,320)
- Stop loss: ₹1,280 (about 3.0% risk)
- Time frame: 3 to 5 weeks
- Rationale: Pharma index was the best-performing sector at -0.21%
- Key risk: US pricing pressure on generics
UltraTech Cement: Is ₹11,000 Within Reach?
- CMP: ₹10,958.00 (22 Oct)
- Trigger: 0.38% below ₹11,000
- Entry range: ₹10,850 to ₹10,960
- Target: ₹11,600 (about 6.4% upside from ₹10,900)
- Stop loss: ₹10,580 (about 2.9% risk)
- Time frame: 4 to 8 weeks
- Rationale: Profit up 21.29% and revenue up 18.81%
- Key risk: Fuel cost inflation with crude at $113
TCS: Will Lower US Yields Revive IT Leadership?
- CMP: ₹2,529.00 (21 Oct)
- Trigger: 16% rally since 12 October; US 10-year yield down to 4.96%
- Entry range: ₹2,480 to ₹2,530
- Target: ₹2,680 (about 6.8% upside from ₹2,510)
- Stop loss: ₹2,430 (about 3.2% risk)
- Time frame: 3 to 6 weeks
- Rationale: AI revenue of $3.1 billion and TCV of $9.6 billion
- Key risk: Nasdaq volatility after a 2.60% fall
HCLTech: Can Earnings Momentum Carry It Past ₹1,450?
- CMP: ₹1,424.20 (21 Oct)
- Trigger: 1.81% below ₹1,450
- Entry range: ₹1,395 to ₹1,425
- Target: ₹1,510 (about 7.1% upside from ₹1,410)
- Stop loss: ₹1,365 (about 3.2% risk)
- Time frame: 3 to 5 weeks
- Rationale: Profit up 21.2% with low debt
- Key risk: Infosys results could sway the sector
Bharti Airtel: Is ₹1,900 the Next Breakout Level?
- CMP: ₹1,891.70 (21 Oct)
- Trigger: Among Nifty gainers on 22 Oct per IIFL Securities
- Entry range: ₹1,870 to ₹1,895
- Target: ₹2,000 (about 6.4% upside from ₹1,880)
- Stop loss: ₹1,825 (about 2.9% risk)
- Time frame: 3 to 6 weeks
- Rationale: Jio IPO pricing sets a high benchmark for telecom valuations
- Key risk: Competition after Jio’s listing
Portfolio Suggestions by Risk Appetite: How Should You Rebalance as Oil Climbs?
Each model portfolio is the blog’s own illustrative allocation, tilted toward oil-light sectors and built from stocks with verified recent earnings or balance-sheet data. Adjust weights to your goals and time horizon.
Conservative Portfolio: How Can You Protect Capital in a Volatile Week?
| Stock | Allocation % | Sector | Recent Earnings Driver |
|---|---|---|---|
| TCS | 20% | IT | Q2 PAT +14.9% |
| Cipla | 15% | Pharma | Defensive outperformance |
| HDFC Bank | 15% | Private Bank | NII +9.7% |
| Coal India | 15% | Mining | Yield 6.27%, P/E 8.37 |
| Infosys | 15% | IT | Yield 4.78%; results 23 Oct |
| Cash / liquid funds | 20% | Cash | Dry powder for further dips |
- Pros: Low crude sensitivity, steady dividends and a large cash buffer.
- Cons: Heavy IT weight of 35% ties returns to global tech sentiment.
Moderate Portfolio: How Do You Balance Growth and Defence?
| Stock | Allocation % | Sector | Recent Earnings Driver |
|---|---|---|---|
| ICICI Bank | 20% | Private Bank | PAT +20.1% |
| HCLTech | 15% | IT | PAT +21.2% |
| UltraTech Cement | 15% | Cement | PAT +21.29% |
| Bharti Airtel | 15% | Telecom | Telecom rerating |
| Indian Hotels | 15% | Hospitality | PAT +22.7%, guidance raised |
| Bajaj Finance | 20% | NBFC | Rebound leadership |
- Pros: Mix of domestic growth and earnings beats with limited oil exposure.
- Cons: NBFC and hospitality stocks are sensitive to rates and consumer spending.
Aggressive Portfolio: Where Are the High-Growth Bets After the Midcap Slide?
| Stock | Allocation % | Sector | Recent Earnings Driver |
|---|---|---|---|
| Beta Drugs | 15% | Pharma | Q2 profit +51.8% |
| Polycab India | 20% | Cables & Wires | PAT +42.59% |
| Tata Communications | 15% | Digital Infrastructure | PAT +86.29% |
| Capri Global Capital | 15% | NBFC | AUM +62%, PAT doubled |
| Le Travenues (ixigo) | 15% | Travel Tech | Return to profit |
| Omnitech Engineering | 20% | Engineering | Fresh defence orders |
- Pros: Exposure to the strongest earnings surprises after a correction in valuations.
- Cons: Midcaps are at a six-month low and could fall further; size positions small.
Final Thought: Is the Market Bending or Breaking Under $113 Oil?
Key Takeaways for 23 October 2026
- Sensex and Nifty fell for a third straight session; both are down 1.98% from 16 October.
- The Nifty is up only 0.30% for October and 2.3% above its 2026 low.
- Brent jumped 4% to $113.17, while the US 10-year yield fell 17 bp to 4.96%.
- Midcap 100 hit a six-month low; pharma and banks were the most resilient sectors.
- Key levels: support 22,555 and 22,400; resistance 22,797 and 22,906.
Three days of losses have trimmed October’s gains, but the Nifty’s doji near 22,555 shows buyers are still defending key support. Today’s Jio Platforms IPO close and Infosys results will set the tone into next week.
Three insights stand out. First, the Nifty has fallen exactly 1.98% from its 16 October peak, while the Midcap 100 hit a six-month low, confirming large caps are cushioning the fall. Second, US 10-year yields dropped 17 basis points on the same day oil jumped 4%, a rare combination that could slow FII selling even as inflation risks rise. Third, Tata Motors PV, Maruti and NTPC hit fresh 52-week lows on the same day Indian Hotels raised guidance, showing how sharply this market is separating winners from losers.
For the next session, watch Infosys results, the final Jio IPO subscription, Brent near $113 and whether the Nifty can reclaim 22,797. A close below 22,555 would open 22,400, while a move above 22,906 would put 23,000 back in play.
Frequently Asked Questions About the Stock Market Today
Why did the Sensex fall for a third day on 22 October 2026?
The Sensex fell 460.30 points to 73,249.39 as Brent crude jumped 4% to $113.17 after attacks on a Saudi Aramco oilfield. A 2.60% Nasdaq fall, a broad Asian sell-off and FII selling of ₹3,458.70 crore also weighed on markets, with media, FMCG and IT the worst sectors.
How will the market open on 23 October 2026?
GIFT Nifty traded at 22,711 late on 22 October, about 23 points above the Nifty’s close, pointing to a flat start, according to HDFC Sky. Key support lies at 22,555 and 22,400, while resistance sits at 22,797 and 22,906 based on pivot levels.
What is the Jio Platforms IPO subscription status?
The Jio Platforms IPO was subscribed 4.38 times by 3 pm on day 2, according to HDFC Sky, with qualified institutional buyers bidding 9.78 times their quota by early afternoon. The ₹30,213 crore issue, priced at ₹1,065 to ₹1,119, closes on 23 October with listing likely on 28 October.
Why did Nestle India shares fall again?
Nestle India fell 2.78% to ₹1,189.90 on 22 October after the food regulator FSSAI issued notices over claims on two infant nutrition products, Upstox reported. The stock is down about 6.7% since 15 October, when it fell 7.76% after September-quarter results.
What is the current RBI repo rate?
The RBI repo rate is 5.50% after a 25 basis point hike at the 5 to 7 October 2026 meeting, the first increase since February 2023. The stance is calibrated tightening. The Standing Deposit Facility is 5.25%, and the MSF and Bank Rate are 5.75%.
Which sectors performed best on 22 October 2026?
Pharma was the most resilient sector, falling only 0.21%, followed by Nifty Bank at minus 0.26% and financial services at minus 0.27%, according to IIFL Securities. Media fell 2.34%, FMCG 1.74% and IT 1.31%, making them the weakest sectors of the day.
Which stocks hit 52-week lows on 22 October 2026?
Tata Motors Passenger Vehicles, Maruti Suzuki, NTPC, Lupin and SRF touched 52-week lows on 22 October, according to Business Standard. Auto and power stocks were hit by rising crude prices and weak demand signals, while SRF recovered to close about 1% higher.
What are the Nifty support and resistance levels for today?
For 23 October, the classic pivot is 22,675.83, with resistance at 22,796.82 and 22,905.98 and support at 22,566.67 and 22,445.68. Ajit Mishra of Religare Broking sees key support at 22,200 to 22,400 and resistance at 22,900, while options data shows the largest call base at 23,000 and put base at 22,000.
How much have FIIs sold in October 2026?
FIIs have sold about ₹52,354 crore of Indian equities in October up to the 22nd, based on provisional data, despite two buying days on 16 and 21 October. DIIs have bought about ₹55,875 crore, keeping combined October flows positive at roughly ₹3,520 crore.
Should I buy stocks after this three-day fall?
The Nifty is only about 2.3% above its 2026 low, and quality large caps in pharma, IT and private banks have held up well. However, oil at $113 and FII selling are real risks. Staggered buying in low-debt leaders suits most investors. Consult a SEBI-registered adviser for personal advice.
Disclaimer
This article is for educational and informational purposes only and does not constitute investment advice or a recommendation to buy or sell any security. Market data is sourced from NSE, BSE, RBI, MoSPI and leading financial publications as of the dates stated and may change. Stock ideas and portfolios represent the blog’s own analysis. Investing in equities involves risk, including loss of capital. Please consult a SEBI-registered investment adviser before making any investment decision.