

Indian Stock Market Trends 2026: What Today’s Data Signals for the Year Ahead
Indian stocks at a crossroads: Sensex 83K+, Nifty eyes 26K amid 7.4% GDP boom & 2.1% inflation shock. RBI holds repo at 5.25%—but hidden sector rotation signals massive 2026 winners. Top gainers/losers exposed! Will Bank Nifty explode? Your portfolio’s next move awaits.
Indian stock market trends are at a fascinating crossroads in February 2026, with the BSE Sensex and NSE Nifty 50 hovering near record zones even as macro indicators like India GDP growth, ultra-low CPI inflation, and steady RBI repo rates paint a unique backdrop for investors. This briefing unpacks where the market stands today (Monday, 09-02-2026), what is driving sentiment, and how you can position your portfolio for the months ahead.
Indian Market Overview (Sensex, Nifty 50, Bank Nifty, Sentiment)
Indian benchmark indices are trading with a mildly positive bias as we head into the 9 February 2026 session, after a constructive close in the previous trading day. On the last close, the BSE Sensex settled around 83,580, up roughly 0.3%, while the NSE Nifty 50 ended near 25,694, higher by about 0.2%.
Index levels and short-term trend
- BSE Sensex: Around 83,580 points as of the latest close, up about 0.32% on the day, about 7% higher versus a year ago and modestly off recent peaks.
- NSE Nifty 50: Around 25,693–25,700 levels, with intraday resistance seen in the 25,800–26,000 zone and key support near 25,500 according to technical analysts.
- Nifty Bank trend: Bank-heavy buying has recently supported the indices, with private banks showing relative strength while PSU banks move more selectively in response to credit growth and asset quality commentary.
Investor sentiment
- Sentiment is cautiously constructive, supported by:
- Upbeat GDP projections for FY26.
- Benign CPI inflation and a predictable RBI monetary policy path.
- However, upside is capped by:
- Profit-booking in IT and pharma.
- Global tech weakness and intermittent risk-off moves in foreign markets.
Overall, the tone is one of buy-on-dips rather than aggressive chasing, with India VIX around low double digits, indicating contained volatility.
Key Economic Drivers: GDP, CPI Inflation, RBI Policy, Unemployment
Macro conditions are unusually supportive: growth remains strong, inflation is very low by historical standards, and the RBI is in a prolonged pause mode.
India GDP growth trajectory
- Official and policy-linked estimates place India’s potential and actual growth in the 7% band.
- Recent projections peg real GDP growth for FY26 around 7.4%, with medium-term potential estimated near 7% and FY27 growth in the 6.8–7.2% zone.
- Drivers include robust private consumption, steady government capex, and resilient services exports.
Implication for markets: sustained real growth above 6.5–7% supports earnings growth across banking, consumer, and infrastructure-linked sectors, underpinning market prediction India narratives that favour equities over most other asset classes.
CPI inflation and inflation trends India
- Headline CPI has been exceptionally soft: recent prints have come in near or below 2%, with the FY26 headline CPI forecast around 2.1%.
- The RBI projects CPI around 3.2% in Q4 FY26, 4.0% in Q1 FY27, and 4.2% in Q2 FY27, partly reflecting a methodological change to the CPI basket.
- For now, inflation trends India-wide are characterized by subdued food prices and still-contained core inflation.
For equities, very low inflation improves real returns and supports higher valuation multiples in rate-sensitive sectors such as banks, NBFCs, autos, and housing-related plays.
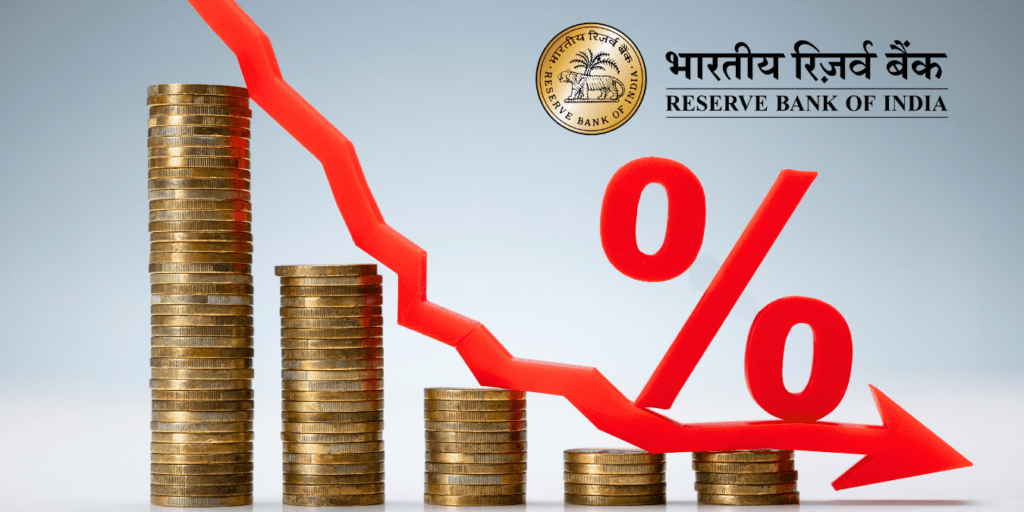
RBI repo rates and monetary policy stance
- The RBI Monetary Policy Committee (MPC) kept the RBI repo rate unchanged at 5.25% in its February 2026 meeting, continuing a pause after cumulative cuts of 125 bps in the previous easing cycle.
- The stance remains broadly neutral, with the central bank signalling comfort with growth and caution on not overreacting to temporarily low inflation.
This combination of steady repo rates and strong GDP growth is classic “Goldilocks” territory for equities, especially bluechip stock picks in financials, consumer, and infrastructure.
Labour market and unemployment
- While precise February 2026 unemployment figures vary across surveys, high-frequency labour data suggest stable to mildly improving employment conditions, aided by services, construction, and manufacturing capex cycles.
- Stable employment supports urban consumption, credit growth, and housing, contributing to earnings resilience in banks, consumer discretionary, and cement.


NIFTY Today: Point-wise Technical and Tactical View
Focusing on Nifty 50 for the current trading setup around Monday, 09-02-2026:
- Nifty is trading near 25,700 levels, with resistance at 25,800–26,000, where previous supply and profit-booking have emerged.
- On the downside, 25,500 is seen as a crucial support zone; a sustained break below this may trigger deeper consolidation toward prior swing lows.
- Momentum indicators are in a neutral to mildly overbought zone, suggesting limited upside unless fresh triggers—such as earnings upgrades or global risk-on signals—appear.
- Sector rotation is evident: private banks, select consumer names, and high-quality industrials are absorbing flows, while IT and pharma witness intermittent selling.
- India VIX around sub-12 levels indicates low implied volatility; this favours range-bound trading strategies and systematic accumulation on dips over chasing intraday spikes.
- For positional traders, staying long with a trailing stop just below 25,500 and booking partial profits near 25,900–26,000 remains a sensible framework in the current tape.
Sensex vs Nifty 50 Trends – February 2026
The table below compares the broad February 2026 trends for BSE Sensex and NSE Nifty 50 using the latest accessible data.
Index trend snapshot – February 2026
| Feature | BSE Sensex (Feb 2026) | Nifty 50 (Feb 2026) |
| Latest close level (approx) | 83,580.4 points | 25,693.7 points |
| Daily move (last session) | +0.32% | +0.20% |
| 1-month change | About −1.6% from prior month high | Mild consolidation below recent highs |
| 1-year performance | Around +7.3% YoY | High single-digit to low double-digit gains YoY |
| Volatility (India VIX proxy) | Low, supportive | India VIX near 11.9, low volatility |
| Sector tilt | Financials, energy, industrials heavy | Broader mix incl. IT, FMCG, financials, autos |
| Market participation | Driven by private banks and consumers | Wider participation but profit-booking in IT/pharma |
| Technical view | Stable uptrend with intermittent corrections | Range-bound between 25,500 and 26,000 near term |
Latest Market News Highlights and Their Impact
Several latest market news items are shaping short-term sentiment and positioning in Indian equities.
Key news drivers
- US–India interim trade agreement optimism
- Hopes around a favourable trade arrangement have supported risk-on sentiment in Indian markets, especially in export-oriented sectors and companies with US linkages.
- Immediate impact: positive for IT services, specialty chemicals, and select manufacturing exporters, though global tech weakness tempers near-term IT performance.
- RBI MPC February 2026 decision
- Repo rate unchanged at 5.25%, neutral stance, with FY26 GDP growth projection around 7.4% and inflation near 2.1%.
- Immediate impact: supportive for banks, NBFCs, real estate, and interest-rate-sensitive consumption plays, as funding costs stabilize and credit growth remains healthy.
- CPI basket and methodology changes
- The shift to a newer CPI base year and altered weightings implies that future CPI prints may be moderately higher (20–40 bps) compared with the old series.
- Immediate impact: limited in the very short term but important for medium-term bond yields and rate expectations; equities are still treating inflation as benign.
- Sector-specific earnings and guidance
- Recent earnings season reveals strong numbers from private banks, stable performance from consumer staples, and mixed commentary in IT due to global tech softness.
- Immediate impact: rotation into financials, select consumption, and industrials; de-rating pressures in certain IT midcaps and export-heavy pharma holdings.
- Global cues and foreign institutional flows
- Movements in US equities, especially tech-heavy indices, and Chinese market volatility continue to influence daily FIIs flows into India.
- Immediate impact: intraday volatility in large-cap IT, metals, and cyclicals; FIIs often sell into global risk-off and buy into India-specific positive macro news.
Foreign Indices That Influence Indian Markets
Global risk appetite and foreign indices play an important signaling role for Indian equities.
Key foreign indices and their influence
- S&P 500 (US): Sets the tone for global risk assets; weakness in US tech and high-duration growth stocks can spill over into Indian IT and internet names.
- NASDAQ Composite (US): Particularly relevant for Nifty IT and Indian tech-heavy portfolios, due to revenue dependence on US clients.
- Dow Jones Industrial Average (US): Influences sentiment around global cyclicals, financials, and industrials; strong Dow days can support Indian banks and capital goods.
- FTSE 100 (UK) and Euro Stoxx indices (Europe): Affect export-driven sectors like pharma, auto components, and engineering that have Europe-linked revenue exposure.
- Nikkei 225 (Japan) and Hang Seng (Hong Kong): Act as proxies for Asia risk-on/risk-off; sharp moves can affect FIIs’ regional allocation decisions and flows into India.
- Shanghai Composite (China): Competes with India for EM portfolio allocation; weakness in China sometimes benefits India as an alternative EM destination.
While exact daily percentage moves vary, traders in India routinely track these indices to gauge overnight cues and anticipate gap-up or gap-down openings in the Sensex and Nifty.
Performance Overview: Top Stocks to Watch for 2026
Below is a model list of top NSE/BSE stocks that many investors may consider for 2026 based on sector positioning, valuation metrics (P/E or PEG where applicable), dividend yields, and structural triggers. These are illustrative categories, not personalized advice; always cross-check live data on NSE/BSE and from your broker.
10 stocks to consider for 2026 (conceptual framework)
- Large private sector bank (e.g., top Nifty financial name)
- Rationale: Strong credit growth, stable asset quality, operating leverage as rates stabilize.
- Valuation: Reasonable P/B vs. historical averages; PEG supportive given earnings visibility.
- Triggers: Loan growth in retail and MSME, benign credit costs, positive regulatory backdrop.
- Leading PSU bank with improving balance sheet
- Rationale: Turnaround in asset quality and improving RoE; benefitting from government capex and PSU reforms.
- Valuation: Lower P/B with scope for re-rating if return metrics sustain.
- Triggers: Slippages under control, capital adequacy, divestment or consolidation news.
- Top consumer staples major
- Rationale: Defensive earnings, strong brands, pricing power even in low inflation environment.
- Valuation: Elevated P/E but often justified by consistency and high RoE.
- Triggers: Rural demand recovery, premiumization, input cost stability.
- Large telecom operator
- Rationale: Ongoing ARPU improvement, 5G monetization, and data consumption growth.
- Valuation: EV/EBITDA metrics reflective of a quasi-utility with growth.
- Triggers: Tariff hikes, subscriber mix improvement, deleveraging.
- Diversified conglomerate with energy and consumer exposure
- Rationale: Beneficiary of India’s consumption and infra cycle, plus refining and petrochemicals.
- Valuation: SOTP (sum-of-the-parts) remains the lens; earnings leverage to energy and retail growth.
- Triggers: Retail or digital IPOs, capex payoffs, policy tailwinds.
- IT services large cap
- Rationale: Long-term digital transformation and cloud demand, even if short-term global tech sentiment is volatile.
- Valuation: Reasonable forward P/E if growth normalizes after global tech wobble.
- Triggers: Deal wins, margin recovery, US–India trade clarity.
- Pharma and healthcare major
- Rationale: Structural demand, India cost advantage, diversification across generics and specialty.
- Valuation: EV/EBITDA reasonable in many names after recent corrections.
- Triggers: USFDA clearances, product launches, domestic chronic portfolio growth.
- Capital goods or engineering leader
- Rationale: Direct exposure to government and private capex, particularly in infra, renewables, and manufacturing.
- Valuation: Rich in some names but supported by order book visibility.
- Triggers: New order inflows, margin expansion, export wins.
- Quality midcap in specialty chemicals
- Rationale: China+1 shift, rising global outsourcing to India.
- Valuation: PEG ratios can be favourable if earnings compound at high teens.
- Triggers: New capacities, long-term contracts, margin improvement.
- Consumer discretionary / auto major
- Rationale: Benefiting from rising disposable incomes, premiumization, and replacement demand.
- Valuation: Depends on volume growth and margin trajectory.
- Triggers: New launches, rural recovery, benign commodity costs.
Use this as a portfolio template: blend high-quality large caps (banks, FMCG, diversified conglomerates, IT) with selective midcaps (chemicals, engineering, niche consumption) for 2026.
Today’s Top Gainers and Losers (Illustrative Snapshot)
The real-time list of top gainers and losers changes intraday; the data below reflect a recent 2026 snapshot from NSE/BSE and are for illustration of structure and style rather than live trading signals. Always verify live quotes on NSE/BSE or your broker’s terminal before acting.
Top gainers – Recent Nifty/Sensex snapshot
| Rank | Stock | Exchange | Last Price (₹) | Change (%) | Brief comment |
| 1 | ITC Ltd | BSE/NSE | 325–326 | +5.0–5.1 | Strong buying on value plus steady earnings; defensive, dividend-paying FMCG story. |
| 2 | Kotak Mahindra Bank Ltd | BSE/NSE | 422 | +3.3–3.4 | Gains on stable asset quality and optimism on credit growth. |
| 3 | Hindustan Unilever Ltd | BSE/NSE | 2,420 | +2.6–3.0 | Benefitting from rotation into staples amid low inflation. |
| 4 | Bharti Airtel Ltd | BSE/NSE | 2,038 | +2.3 | ARPU tailwinds and tariff hike expectations support sentiment. |
| 5 | Bajaj Finance Ltd | BSE/NSE | 982 | +1.7–1.8 | NBFC gains on benign funding costs and resilient retail credit demand. |
| 6 | Bajaj Finserv Ltd | NSE | 2,024 | +1.2 | Financial-services holding company benefits from underlying businesses’ momentum. |
| 7 | Power Grid Corp of India | BSE/NSE | 293 | +1.2 | Regulated utility play in power transmission; benefitting from infra focus. |
| 8 | Titan Company Ltd | BSE/NSE | 4,140 | +0.9–1.1 | Jewellery and premium retail consumption story remains strong. |
| 9 | Axis Bank Ltd | BSE/NSE | 1,342 | +0.8 | Gains on stable credit cost guidance and retail franchise strength. |
| 10 | Shriram Finance Ltd | BSE/NSE | 1,002 | +1.0 | NBFC with strong presence in vehicle and MSME finance; benefits from cyclical upturn. |
Top losers – Recent Nifty/Sensex snapshot
| Rank | Stock | Exchange | Last Price (₹) | Change (%) | Brief comment |
| 1 | HDFC Life Insurance Co Ltd | NSE | 703.5 | −2.4 | Pressure from regulatory concerns and margin commentary. |
| 2 | Tech Mahindra Ltd | BSE/NSE | 1,619 | −1.6–1.7 | Hit by global tech weakness and near-term earnings uncertainty. |
| 3 | Tata Consultancy Services Ltd | BSE/NSE | 2,942 | −1.7 | Profit-taking after prior outperformance; sensitivity to US tech cycles. |
| 4 | Bajaj Auto Ltd | BSE/NSE | 9,520 | −1.2–1.3 | Volatility around export demand and margin visibility. |
| 5 | Asian Paints Ltd | BSE/NSE | 2,401–2,403 | −1.2–1.3 | Concerns over competitive intensity and input cost trends. |
| 6 | Adani Ports & SEZ Ltd | BSE/NSE | 1,550 | −1.2–1.3 | Sensitivity to global trade flows and risk sentiment. |
| 7 | Wipro Ltd | BSE/NSE | 231 | −1.1 | Ongoing business transition and margin questions. |
| 8 | SBI Life Insurance Co Ltd | BSE/NSE | 1,993–1,997 | −1.0–1.1 | Margin and regulatory worries similar to other life insurers. |
| 9 | HCL Technologies Ltd | BSE/NSE | 1,593 | −1.0 | Weakness linked to global tech and enterprise spending caution. |
| 10 | Grasim Industries Ltd | BSE/NSE | 2,835–2,837 | −0.9–1.1 | Consolidation after prior gains; watch capex and financial mix. |
Sector Performance India 2026: IT, Banking, Pharma, Consumer
Sector rotation is defining sector performance India 2026, with financials and consumption leading while IT and pharma consolidate.
Sector performance and earnings – recent trends
| Sector | Recent performance tone (2026) | Earnings / fundamentals snapshot | Market narrative |
| Banking (incl. Nifty Bank) | Outperformance vs. broader market; private banks strong, PSU banks selective. | Healthy loan growth, improving RoE, benign NPAs. | Plays on GDP growth, low inflation, and stable rates; core pillar of India equity thesis. |
| IT services | Under pressure short term, mixed moves across large and midcaps. | Order books decent but pricing and client budgets watched closely. | Global tech risk and US macro cues dominant; buy quality on dips theme for long term. |
| Pharma & healthcare | Mixed; some defensive support, but stock-specific moves dominate. | US price pressure persists; domestic chronic and branded portfolio stable. | Selective stock picking required; regulatory risk and R&D pipeline key. |
| Consumer staples (FMCG) | Benefiting from rotation into defensives; positive day for large FMCG names. | Margins aided by low commodity prices, steady rural traction. | Seen as safe haven with dividends and pricing power in low inflation regime. |
| Consumer discretionary | Reasonably strong over 1–2 year view; near-term moves tied to income sentiment. | Earnings sensitive to demand cycles and cost inflation. | Plays on aspirational consumption and urban recovery. |
| Industrials / capital goods | Structural uptrend on back of infra and manufacturing capex. | Healthy order books, improving capacity utilisation. | Favoured in market prediction India narratives tied to capex super-cycle. |
| Metals & commodities | Volatile; influenced by China data and global demand. | EPS sensitive to global prices and forex. | Trading-oriented; less of a long-term core for conservative investors. |
Analysis and Recommendations: Portfolio Ideas by Risk Appetite
This section outlines actionable insights and a model diversified allocation framework tailored to different risk appetites. Treat this as educational guidance; not a substitute for professional advice or your own due diligence.
Conservative investor (capital preservation first)
- Focus on large-cap bluechip stock picks across banking, FMCG, and utilities.
- Illustrative allocation idea:
- 35–40% in top private and select PSU banks.
- 25–30% in FMCG and consumer staples.
- 10–15% in utilities, power, and telecom.
- 10–15% in high-quality IT and pharma majors.
- Pros: Lower drawdowns, stable dividends, better sleep-at-night factor.
- Cons: Limited upside vs. aggressive strategies during bull phases; valuations may be rich in certain defensives.
Moderate investor (balanced growth and risk)
- Blend quality large caps with select midcaps in structural growth areas.
- Illustrative allocation idea:
- 30–35% in banks and diversified financials.
- 20–25% in consumption (staples + discretionary).
- 15–20% in IT and pharma combined.
- 15–20% in industrials, capital goods, and specialty chemicals.
- Pros: Reasonable upside participation with risk still manageable; good for 3–5 year horizons.
- Cons: Requires periodic rebalancing; midcap volatility can spike in risk-off episodes.
Aggressive investor (maximizing growth potential)
- Higher allocation to midcaps, sector leaders in emerging themes, and cyclicals.
- Illustrative allocation idea:
- 25–30% in core large-cap banks and index leaders as a stabilizer.
- 30–35% in high-growth midcaps (chemicals, manufacturing, digital services).
- 15–20% in cyclical plays (infra, autos, metals) timed with macro cycles.
- 10–15% in thematic bets (renewables, EV ecosystem, niche healthcare).
- Pros: Significant upside potential if Indian stock market trends remain favourable and GDP stays above 7%.
- Cons: Higher volatility, drawdowns; demands strong risk management and longer holding periods.
Recent earnings drivers to watch
- Banks: Net interest margins (NIMs), credit growth in retail and SME, provisioning trends.
- FMCG: Volume growth vs. price-led growth, rural vs. urban mix, gross margin trend.
- IT: Total contract value (TCV), commentary on US and Europe demand, margin levers.
- Industrials: Order inflows, execution speed, working capital discipline.
When building or rebalancing your portfolio, tie your stock selection to these earnings drivers rather than just short-term price moves.
Stock Recommendations for Today: Practical, Point-Wise Framework
Instead of naming intraday trading bets, which can change quickly, here is a structured stock recommendation framework for today that you can apply before the 09-02-2026 session using live data from NSE/BSE.
- Start with index heavyweights
- Identify 5–8 large-cap leaders in Nifty 50 with strong earnings visibility, preferably in banking, FMCG, telecom, and quality IT.
- Check: recent results, debt levels, and guidance summaries from company filings and leading financial portals.
- Use Nifty’s range (25,500–26,000) as context
- If Nifty opens near support (25,500–25,600), focus on accumulation of quality stocks on dips rather than aggressive selling.
- If Nifty approaches resistance (25,800–26,000), consider partial profit booking in over-extended positions.
- Screen for relative strength among sectors
- Today, prioritize sectors showing higher relative strength vs. the index over the past few sessions: banks, consumer, select industrials.
- De-emphasize sectors consistently underperforming (certain IT and pharma names) unless valuations are compelling and the business case is strong.
- Combine fundamentals with technicals
- Look for stocks where fundamentals (earnings, balance sheet, sector tailwinds) align with technical patterns (uptrend, higher highs, supports holding).
- Avoid purely speculative names with weak fundamentals unless you have a strict trading plan and stop-loss.
- Align picks with your risk level
- Conservative: Stick to index names and top large caps with stable dividends and robust cash flows.
- Aggressive: Add select midcaps from sectors with multi-year tailwinds (chemicals, capital goods, domestic manufacturing).
- Set clear risk management rules
- Define maximum position size per stock.
- Use stop-loss levels based on support zones or acceptable percentage drawdowns.
By applying this framework each morning with fresh data from NSE India, BSE, and your broker’s analytics, your stock recommendations for today will remain dynamic, data-driven, and aligned with evolving Indian stock market trends.
Final Thought: How to Use 2026’s Macro Sweet Spot
India enters 2026 with a rare combination of strong GDP growth, unusually low CPI inflation, and a steady RBI repo rate, all set against equity indices that are high but not yet in bubble territory. For investors who can look past daily noise and focus on earnings drivers in banking, consumption, select IT, and capital goods, this environment offers one of the most attractive medium-term setups in recent memory.
The key is to treat every dip toward Nifty support zones as a chance to accumulate quality rather than panic, while using global cues and foreign indices as context—not as the sole driver of your decisions. If you found this market briefing useful for navigating Indian stock market trends in 2026, consider sharing it with fellow investors or leaving a comment with your own sector views and portfolio questions.
Disclaimer: The use of any third-party business logos in this content is for informational purposes only and does not imply endorsement or affiliation. All logos are the property of their respective owners, and their use complies with fair use guidelines. For official information, refer to the respective company’s website.
Disclaimer: This analysis on Indian stock market trends is for educational and informational purposes only and does not constitute financial, investment, legal, tax, or accounting advice. Markets are volatile; past performance isn’t indicative of future results. Consult a qualified financial advisor before making investment decisions.


: What Every Investor MUST Know Before the Bell Rings 5")
: Sensex Plunges, Nifty at Crossroads — What Every Investor Must Know Right Now 6")

: Sensex Slides, Nifty at Crossroads — What Every Smart Investor Must Know Right Now 8")


: What Every Investor MUST Know Before the Bell Rings 13")


