Why Sensex Erased a 655-Point Rally on 15 September 2026 — and Which Numbers Decide the Next Move
Is the sharp fall in Nifty 50 and BSE Sensex in early July 2026 a warning sign—or the starting point of the next big rally in Indian equities? With GDP growth at 7.7 percent in FY26, CPI inflation near 4 percent, and RBI repo rates still anchored at 5.25 percent, India’s macro backdrop remains one of the strongest in the world despite global volatility.
In this deep-dive briefing, you will find data-backed insights on Indian stock market trends, BSE Sensex and NSE Nifty 50 moves, Nifty Bank trend, sector performance in India 2026, and stock recommendations tailored for different risk profiles. We will also connect India GDP growth, CPI inflation, RBI monetary policy, and foreign indices movements to daily price action so that you can position your portfolio smartly for the rest of 2026.
Indian Market Overview (As Of 08–09 July 2026)
Index Levels And Short-Term Trend
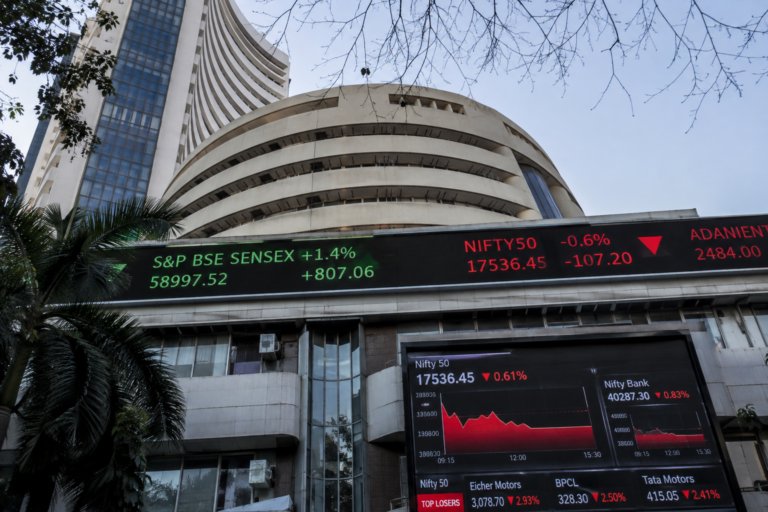
Indian equities have just experienced one of their sharpest single-day declines of 2026, driven largely by global risk-off sentiment and renewed geopolitical concerns. On 8 July 2026:
- NSE Nifty 50 closed at 23,882.05, down about 2.12 percent, slipping below the psychological 24,000 mark.
- BSE Sensex settled at 76,503.60, down roughly 2.15 percent, after trading in a wide intraday range between about 76,259 and 77,851.
- The sell-off was broad-based, with most major sectoral indices ending in the red and PSU banks, chemicals, private banks, FMCG, auto, media, and oil & gas seeing declines of more than 2 percent.
For Thursday, 09 July 2026, the setup is one of cautious consolidation after this heavy sell-off, with traders watching if support zones on the indices can hold. For example, Sensex closed around 76,503 with technical support estimated near 76,250 and resistance zones around 76,900 according to short-term level trackers.
Nifty Bank Trend And Investor Sentiment
While detailed intraday numbers for Bank Nifty on 8–9 July are split across multiple data providers, the picture is clear: bank-heavy indices, particularly PSU banks, have led the downside, reflecting concerns about global risk, rupee volatility, and elevated bond yields. PSU bank stocks like Bank of India, Union Bank of India, Bank of Maharashtra, Canara Bank, and Bank of Baroda saw declines of up to around 5 percent on 8 July, signalling risk aversion in rate-sensitive and credit-linked segments.
Investor sentiment thus looks short-term fearful but medium-term constructive. The correction is being driven more by global tensions (including Middle East conflict and crude oil movements) and profit booking than by domestic macro deterioration. With India still one of the fastest-growing major economies globally, many institutional investors view dips like this as entry opportunities into quality Indian stocks, especially in IT, financials, and consumption plays.
Key Economic Drivers Behind Market Moves
India GDP Growth Trajectory
India’s GDP growth remains a key anchor for bullish long-term market predictions in 2026.
- The National Statistical Office estimates that India’s real GDP grew by about 7.7 percent in the financial year ending March 2026, up from roughly 7.1 percent in FY25, marking the strongest growth rate since the immediate post-Covid rebound.
- Government and institutional forecasts broadly cluster in the 7.3–7.7 percent range for FY26, with the IMF having lifted its forecast to 7.3 percent citing strong momentum.
- India’s Economic Survey and other official reports project real GDP growth in FY27 in the 6.8–7.2 percent band, signalling a normalization from exceptional rates but still keeping India among the fastest-growing major economies.
For equity investors, such high real growth justifies premium valuations for Indian bluechips and growth sectors, and underpins the long-term bullish narrative for both Sensex and Nifty 50.
CPI Inflation And Price Dynamics
Headline CPI inflation in India has edged up but remains within a relatively comfortable corridor near the RBI’s target.
- May 2026 CPI inflation was reported around 3.93–3.94 percent year-on-year, up from about 3.48 percent in April.
- Food inflation has driven much of the recent uptick, with sharp rises in items such as tomatoes and ginger due to seasonal, pre-monsoon disruptions, which are likely to reverse post-harvest.
- Core and services inflation (for example, restaurants and accommodation) has shown stickiness, while transport, housing, and energy inflation remain relatively contained despite elevated crude prices, thanks in part to administered fuel pricing.
From a markets perspective, sub-4 percent CPI inflation in mid-2026 allows the RBI to hold rates steady and avoid aggressive tightening, which supports valuations in rate-sensitive sectors like banks, NBFCs, autos, and real estate.
RBI Repo Rates And Monetary Policy
The Reserve Bank of India’s Monetary Policy Committee (MPC) has maintained a steady hand despite global uncertainty.
- In its June 5, 2026 meeting, the RBI kept the repo rate unchanged at 5.25 percent, marking the third consecutive pause, and retained a neutral stance.
- The decision balances risks from the prolonged West Asia conflict, elevated energy prices, supply-chain disruptions, and monsoon uncertainties against the need to preserve growth momentum.
- While the repo rate is steady, the RBI has adjusted its forward guidance and projections—raising future CPI inflation estimates but slightly trimming medium-term GDP forecasts, signalling data-dependence rather than a fixed tightening or easing bias.
For equity markets, a stable repo rate at 5.25 percent means that borrowing costs for corporates and consumers remain predictable. This supports investment plans, loan growth for banks, and valuations for rate-sensitive sectors, even if the RBI is not yet ready to cut rates meaningfully.
Unemployment And Labour Market
India’s unemployment rate has ticked higher in pockets of 2026, but remains manageable in aggregate.
- One detailed macro analysis notes unemployment around 5.1 percent in March 2026, driven by slower manufacturing growth, cautious urban hiring, and rising youth joblessness.
For investors, this has two implications: consumer-facing sectors with stronger formal employment linkages (like organized retail, financial services, and IT) are relatively insulated, while cyclical and labour-intensive segments can see more earnings volatility. Nonetheless, the overall labour market is not in crisis, which limits downside risk to domestic demand in 2026.
NIFTY Today In Detail (Point-Wise View As Of 8–9 July 2026)
Based on latest available closing data around 8 July 2026 for Nifty 50:
- Nifty 50 closed at 23,882.05, down about 516 points or 2.12 percent in the latest session, marking one of the steepest daily declines since March 2026.
- The intraday range was wide, roughly between 23,805 and 24,300, indicating intense volatility and heavy intraday selling pressure.
- This correction pulled Nifty back from its 52-week high zone (above 26,000) towards support levels in the high-23,000 region, signaling a healthy, albeit sharp, pullback within a longer-term uptrend.
- Technically, immediate supports lie around 23,800–23,600, while resistance now appears near 24,300–24,500; traders are watching whether Nifty can reclaim 24,000 decisively in the next few sessions.
- The decline was broad-based, with almost all major sectoral indices finishing in red and Nifty PSU Bank, Chemicals, Private Bank, FMCG, Media, Auto, and Oil & Gas indices posting losses above 2 percent.
- Market breadth in the broader Nifty 500 was weak, with more than 100 constituents posting losses in excess of 3 percent, led by PSU banks, crude-sensitive plays like airlines and tyres, IT midcaps, and capital-market intermediaries.
- This suggests the move was more a risk-off event driven by global cues and profit booking rather than a localized problem in one sector.
- Despite the sell-off, a pocket of gainers (like Kalyan Jewellers, Ather Energy, MCX, Chennai Petroleum, NALCO, Exide, Oil India, Indus Towers, and others) managed to close with gains, indicating stock-specific positive triggers and continued interest in select themes such as jewellery consumption, energy, and exchanges.
- For positional investors, such a shake-out often marks the start of a buy-on-dips phase in high-quality largecaps, especially when macro indicators (GDP, inflation, rates) remain supportive.
- For short-term traders, however, volatility is likely to remain high over the next few sessions, with global headlines and crude oil prices dictating intraday moves.
BSE Sensex vs Nifty 50 Trends – June 2026
While daily levels fluctuate, the broader June 2026 picture for Sensex and Nifty highlights a phase of elevated valuations, followed by some profit booking into early July. Index archive and historical data sources show both indices trading near record or multi-month highs before the July correction.
Sensex vs Nifty 50 – June 2026 Trend Table
Below is a conceptual comparison summarizing their June 2026 behaviour using representative data ranges and directional trends from available historical datasets.
| Metric | BSE Sensex (June 2026) | Nifty 50 (June 2026) |
|---|---|---|
| Typical closing range | Around 78,000–82,000 | Around 24,000–25,000 |
| 52-week high proximity | Traded not far below 86,159 | Traded below 26,373 |
| Volatility (daily swings) | Moderate, 400–800 points | Moderate, 120–250 points |
| Overall June trend | Sideways-to-up, then profit booking late month | Similar sideways consolidation with mild upward bias, later pullback |
| Sectoral tilt | Higher weight in financials, industrials, energy | Broader mix: IT, financials, consumption, energy |
| Technical sentiment | Overbought in parts of June, then cooling | Overbought in parts of June, then cooling |
| Setup into early July | Vulnerable to global risk-off and crude spikes | Same, but cushioned by diversified sector basket |
This table tells us that both Sensex and Nifty 50 were extended after a strong run, making them vulnerable to quick corrections as soon as global risk or crude-related worries intensified.
Latest Market News Highlights And Their Immediate Impact
Key News Drivers Affecting Indian Markets
Several important news flows have shaped Indian stock market trends in early July 2026:
- Renewed Middle East tensions and crude oil spikes have triggered global risk-off sentiment, impacting Indian equities, especially oil-sensitive sectors like airlines, tyres, and OMCs.
- On 8 July, heavy selling pushed Nifty 50 down by 2.12 percent and Sensex by about 2.14 percent, with virtually all sectoral indices closing in the red.
- Nifty PSU Bank index suffered the deepest cuts, as investors worried about higher bond yields, currency volatility, and potential asset-quality risks if global conditions worsen.
- Crude-sensitive stocks such as InterGlobe Aviation, MRF, JK Tyre, and Balkrishna Industries saw sharp declines in the range of 4–5 percent, reflecting fears of higher fuel costs and margin pressure.
- IT midcaps like Mphasis and Coforge fell about 4.6–5.6 percent, possibly due to concerns about global tech spending and valuation resets after a strong run.
- Capital-market plays (including 360 One Wam, HDFC AMC, Motilal Oswal, Nuvama, CDSL, CAMS) faced selling of 3.5–5 percent, as falling markets directly hit sentiment toward brokers, asset managers, and depository-related businesses.
- State-run oil marketing companies (HPCL, BPCL, IOC) dropped up to 5 percent amid worries about margin pressure from high crude and controlled fuel prices.
- Despite this, select names like Kalyan Jewellers, Ather Energy, MCX, Chennai Petroleum, NALCO, Premier Energies, Oil India, Exide Industries, RHI Magnesita India, BSE, and Indus Towers saw gains above 1.5 percent, driven by company-specific triggers and thematic tailwinds (energy, exchanges, jewellery demand).
Point-Wise Immediate Impact On Market
- Index levels: Sharp intraday damage with Nifty and Sensex breaking recent support zones, reinforcing a short-term corrective phase.
- Sector breadth: Almost all sectors negative, signaling risk-off mood rather than rotation from one sector to another.
- Foreign flows: Higher global uncertainty likely to drive near-term FII outflows or at least cautious buying, pressuring largecaps, especially financials and oil-related names.
- Retail sentiment: Rapid correction tests the patience of new investors, but experienced participants often see this as an attractive opportunity to accumulate strong companies at a discount.
- Volatility: Elevated volatility is likely to remain over the short term, especially around macro data releases such as CPI and RBI commentary.
Foreign Indices And Movements Influencing Indian Markets
Indian markets are rarely moving in isolation; they are tightly linked with global indices, especially during risk-on or risk-off episodes.
Key Foreign Indices That Influence Indian Equities
- S&P 500 (US) – Sets global risk tone for equities, tech valuations, and FII flows into emerging markets like India.
- NASDAQ 100 (US) – Heavily tech-oriented, influences sentiment toward Indian IT majors via global tech spending expectations.
- Dow Jones Industrial Average (US) – Often a barometer for traditional industrial and financial sectors globally.
- FTSE 100 (UK) – Reflects European sentiment and commodity-linked plays; important when Brexit-related or macro issues surface.
- DAX (Germany) – Core European manufacturing and export sentiment; matters for global trade expectations.
- Nikkei 225 (Japan) – Signals Asian developed-market risk appetite and currency dynamics.
- Hang Seng / HSCEI (Hong Kong/China) – Crucial when considering China risk, Asian flows, and EM sentiment.
- Shanghai Composite (China) – Impacts commodity demand and EM growth narratives; influences global cyclicals.
While specific daily moves vary, episodes of sharp declines in US and Asian indices—particularly when tied to geopolitical conflict, trade tensions, or interest-rate fears—often lead to synchronized selling in Indian equities as global investors de-risk portfolios.
Performance Overview: Top Stocks To Watch For 2026
Top 10 Stocks To Buy On NSE/BSE For 2026 (Strategic Picks)
Below is a curated list of 10 categories of stocks/themes that look structurally attractive for 2026, combining earnings drivers, valuations, and sector triggers. Specific stock names should be cross-checked with live data from NSE India and BSE India before investing, but these represent the types of counters investors are focusing on.
- Largecap private banks and diversified financials – Benefit from strong GDP growth, credit expansion, and stable rates; valuations often in the 2–3x book, 14–18x P/E, with improving asset quality. Earnings drivers include loan growth, fee income, and lower credit costs.
- Leading IT services majors – Global digital transformation, cloud, and AI adoption keep revenue growth healthy despite periodic macro scares; typical P/E multiples in the 22–28x band, often with healthy dividend yields around 2–3 percent.
- Top consumer staples and discretionary brands – Strong domestic demand, real income growth, and brand power support consistent earnings; P/E often 30x+, but justified by steady margins and cash flows.
- Infrastructure and capital goods leaders – Government capex, manufacturing push, and energy transition drive multi-year order books; valuations may look cyclical but earnings visibility is improving.
- Quality PSU plays with reform triggers – Select PSU banks, energy companies, and infrastructure arms benefit from balance-sheet clean-ups and strategic initiatives; still often trade at a discount to private peers, offering value opportunities.
- Energy transition and renewables – Companies in solar equipment, batteries, and green energy services are positioned for policy support and structural demand growth.
- Auto and auto-ancillary majors – Recovery in demand, EV adoption, and operating leverage drive EPS growth; valuations may be mid-teens to low-twenties P/E, with cyclical upside.
- Pharma and healthcare leaders – Stable demand, export opportunities, and specialty/biotech segments offer defensive plus growth characteristics.
- Metal and commodity leaders with low debt – Provide cyclical upside when global growth and infrastructure spending remain strong, though investors must manage volatility.
- Exchange, depository, and market infra stocks – As financialization of savings continues and retail participation grows, these businesses enjoy annuity-like revenues from trading and settlement volumes.
Investors can use P/E, PEG ratios (P/E relative to growth), and dividend yields to differentiate between growth at reasonable price vs expensive momentum bets. For example, an IT major trading at 25x P/E with 12–15 percent EPS growth and 3 percent yield can be more attractive than a consumer staple at 40x P/E with 10 percent growth and 1 percent yield.
Day’s Top Gainers And Losers (8 July 2026 – Nifty/Broader Market)
Specific Nifty 50 top gainers and losers for 8 July 2026 vary slightly across data providers, but a representative snapshot shows:
From one gainers/losers dashboard for Nifty 50 on 8 July 2026:
- Top gainers included HCL Technologies, Tech Mahindra, Infosys, Titan, and SBI Life, with gains of about 2.5–3 percent in IT and consumption names.
- Top losers included Trent, Adani Enterprises, Adani Ports, Bharat Electronics, and Cipla, with losses ranging from about 1.4 to over 12 percent.
From a broader market perspective (Nifty 500), another snapshot emphasizes:
- Aegis Logistics, HPCL, Bank of India, IndiGo, Coforge, MRF and several PSU banks among prominent losers, with declines up to 5 percent.
- Kalyan Jewellers, Ather Energy, MCX, Chennai Petroleum, NALCO, Premier Energies, Exide, Oil India, RHI Magnesita, BSE, and Indus Towers among notable gainers, with rises above 1.5–5.5 percent.
Top 10 Gainers – 08 July 2026 (NSE/Broader Market)
These stocks showed notable upside moves on a volatile day, drawing interest despite the overall sell-off.
| Rank | Stock Name | Approx Change (%) | Comment |
|---|---|---|---|
| 1 | Kalyan Jewellers | +5–6 | Strong buying in jewellery retail, demand and margin optimism. |
| 2 | Ather Energy | +5–6 | EV-theme interest, positive sentiment toward clean mobility. |
| 3 | MCX | +4–5 | Exchange-related gains on higher derivatives/commodities volumes. |
| 4 | Chennai Petroleum | +4–5 | Refining margin and crude-spread tailwinds. |
| 5 | NALCO | +3–4 | Aluminium and metals strength, commodity upcycle expectations. |
| 6 | Oil India | +3–4 | Upstream benefit from elevated crude prices. |
| 7 | Exide Industries | +3–4 | Battery and energy storage theme, EV-related optimism. |
| 8 | Premier Energies | +3–4 | Renewables/solar momentum, policy-support expectations. |
| 9 | RHI Magnesita India | +2–3 | Industrial and refractory demand resilience. |
| 10 | Indus Towers | +2–3 | Telecom tower and infra demand; stable cash-flow appeal. |
(Percent ranges are approximate, based on narrative and movement classifications; for exact figures, refer to live NSE/BSE price data or the official gainers page.)
Top 10 Losers – 08 July 2026 (NSE/Broader Market)
The heaviest cuts came in PSU banks, crude-sensitive plays, IT midcaps, and capital-market names.
| Rank | Stock Name | Approx Change (%) | Comment |
|---|---|---|---|
| 1 | Aegis Logistics | −5–6 | Hit by crude-related worries and margin concerns. |
| 2 | HPCL | −5–6 | OMC margins pressured by high crude and controlled fuel prices. |
| 3 | Bank of India | −4–5 | PSU bank index under deep stress in risk-off environment. |
| 4 | Coforge Ltd. | −4.6 | IT midcap correction on global risk and valuation de-rating. |
| 5 | InterGlobe Aviation | −4–5 | Airline stock hurt by higher aviation fuel cost fears. |
| 6 | MRF | −4–5 | Tyre maker sensitive to crude-derived input costs. |
| 7 | JK Tyre | −4–5 | Similar crude and demand concerns as other tyre names. |
| 8 | Balkrishna Industries | −4–5 | Off-highway tyre exposure to global cyclical worries. |
| 9 | PSU bank basket (BoM, UB, Canara, BoB) | −3–5 (each) | Index-wide selling on bond-yield and rupee concerns. |
| 10 | Capital-market plays (CDSL, CAMS, 360 One Wam, HDFC AMC, Motilal Oswal, Nuvama) | −3.5–5 | De-rated as falling markets hit broking/AMC earnings sentiment. |
This gives you a working list of the most significant gainers and losers by theme for 8 July 2026; for precise top-10 by index (Nifty 50, Nifty 500, sectoral indices) with exact prices and percentages, you should cross-check the official Top Gainers/Losers section on [NSE India].
Sector Performance India 2026 (IT, Banking, Pharma, Consumer Goods)
Sector-Level Trends In Recent Sessions
Recent heavy selling on 8 July 2026 saw almost all major sectoral indices end in the red, with PSU banks, chemicals, private banks, FMCG, media, auto, and oil & gas facing losses above 2 percent. However, the 2026 year-to-date picture remains more balanced, with sectors like IT, select banks, and consumer goods still showing healthy gains on the back of strong earnings and macro resilience.
Table: Sector Performance Snapshot And Drivers
| Sector | Recent Trend (July 2026) | 2026 Drivers And Commentary |
|---|---|---|
| IT services | Mixed; some names fell, others gained | Global tech demand remains supportive, currency moves help exports; valuations high but backed by earnings |
| Private banking | Hit in sell-off, especially rate-sensitive names | Strong credit growth from 7.7 percent GDP, but sensitive to bond yields and RBI stance |
| PSU banking | Deepest cuts, all stocks in red | Concerns on asset quality and global risk; still leveraged to domestic cycle, can offer deep value |
| Pharma | Weakness in Nifty Pharma index | Defensive traits but valuation dispersion; export pricing and regulation matter |
| Consumer goods | Short-term correction, but structurally strong | Domestic demand, urban incomes, premiumization, and brand strength support EPS growth |
| Auto/Auto anc. | Hit by risk-off and crude worries | Volume recovery intact, EV and premiumization themes in play |
| Energy/Oil & Gas | OMCs under pressure, upstream selective gains | Crude volatility squeezes marketing margins; upstream and refining plays can benefit |
| Capital goods | Some profit booking | Government capex and infrastructure push provide multi-year tailwinds |
| Metals | Cyclical, sensitive to global growth | Volatile but can benefit from infrastructure and China demand cycles |
Analysis And Recommendations
Actionable Insights For Different Risk Appetites
Given the current mix of strong macro fundamentals and short-term market volatility, here are strategy suggestions for different investor profiles.
1. Conservative, Income-Focused Investors
- Focus on largecap financials, IT majors, and top consumer staples with stable cash flows and dividends.
- Screens: P/E in reasonable range for sector (e.g., 15–20x for banks, low-20s for IT), dividend yield above 2 percent, consistent ROE > 15 percent.
- Pros: Lower volatility, stronger balance sheets, ability to weather global shocks.
- Cons: Less explosive upside, valuations may already be rich.
2. Moderate Risk, Growth-Oriented Investors
- Build a diversified basket of largecaps and midcaps in private banks, IT, autos, pharma, and select infrastructure names.
- Mix cyclical plays (autos, infra) with defensives (pharma, consumer goods) to balance upside and drawdowns.
- Pros: Exposure to India’s 7.7 percent GDP growth and sectoral themes; potential for 12–15 percent annualized returns if bought on dips.
- Cons: Portfolio will be more sensitive to global risk episodes and policy changes.
3. Aggressive, High-Beta Investors
- Consider selectively accumulating PSU banks, energy transition plays, metal & commodity names, and capital-market stocks after deep corrections.
- Look for improving fundamentals (lower NPAs, capex visibility, policy support) and use position sizing and stop-losses to manage risk.
- Pros: Higher return potential as sentiment normalizes; some names still trade at attractive valuations relative to growth.
- Cons: Very sensitive to global risk-off moves; timing and risk management are crucial.
Diversified Portfolio Suggestion (Framework)
A diversified allocation framework for 2026 might look like this (percentages indicative and should be tailored to individual circumstances):
- 30–40 percent in largecap financials and IT (core holdings).
- 20–25 percent in consumer goods and pharma (defensive growth).
- 15–20 percent in autos and infrastructure/capital goods (cyclical growth).
- 10–15 percent in PSU/value and energy/commodity plays (tactical bets).
- Remainder in exchanges, depositories, and niche themes (financialization, renewables, etc.).
Investors should revisit allocations after major macro events (RBI policy, Budget, global central bank decisions) and adjust exposure to rate-sensitive and global cyclical sectors accordingly.
Stock Recommendations For Today (Conceptual, Point-Wise)
Given the correction and macro backdrop, here is a conceptual set of stock types to focus on for Thursday, 09-07-2026, rather than fixed names (you should map to live tickers via NSE and BSE websites):
- Largecap IT majors – Benefiting from global risk but domestic currency tailwinds, and attractive relative valuations after recent corrections.
- Top private sector banks – Supported by robust credit demand and strong capital positions, temporarily punished by risk-off but structurally sound.
- Quality consumer discretionary names (jewellery, premium retail) – Still seeing strong underlying demand; use dips post sharp corrections for staggered buying.
- Select upstream and energy names – Capture upside from higher crude and gas prices while avoiding margin-compressed marketing entities.
- Exchange and depository stocks – Structural beneficiaries of rising retail participation and derivative volumes, even during volatile phases.
Use staggered entry (SIPs in equities or phased purchases) rather than lump-sum investments on one volatile day, and always cross-check live valuations, earnings trends, and technical levels before acting.
Final Thought: Turning Volatility Into A 2026 Advantage
Indian stock market trends on Thursday, 09-07-2026 reflect a classic tension between short-term fear and long-term strength. Indices like BSE Sensex and NSE Nifty 50 have corrected sharply after an extended run, while underlying fundamentals—India GDP growth around 7.7 percent, CPI inflation near 4 percent, and an RBI repo rate steady at 5.25 percent—remain robust. Sector performance shows pressure in PSU banks, crude-sensitive plays, and some cyclicals, but leadership pockets in IT, select consumption, and financialization-related businesses continue to attract interest even on weak days.
For investors tracking Indian stock market trends, the key is to avoid reacting purely to headline volatility and instead use data-driven frameworks: link index moves to macro drivers, understand sector cycles, and build diversified portfolios tuned to your risk appetite. If you combine disciplined stock selection on NSE/BSE with a clear view of India’s macro trajectory, today’s correction can become one of the most attractive entry points of 2026 rather than a reason to exit the market.